Log in to your Inderes Free account to see all free content on this page.
H&M
181.75 SEK +4.18%3,733 investors are following this company
Hennes & Mauritz is a retail chain. The range consists of clothing, shoes, and accessories. The group also includes brands such as COS, Monki, Weekday, Cheap Monday, and Other Stories. Today, the company also conducts business in home furnishings via H&M Home. The company has a presence in all global regions. H&M was originally founded in 1947 and is headquartered in Stockholm, Sweden.
P/E (24e)
20.64
EV/EBIT (adj.) (24e)
16.66
P/B (24e)
5.71
Dividend yield-% (24e)
3.85 %
Target price
170.00 SEK
Recommendation
Reduce
Updated
28.3.2024
NASDAQ Stockholm
HM B
Daily low / high price
176.15 / 181.8
SEK
Market cap
296.2B SEK
Turnover
526.95M SEK
Volume
2.9M
Risk and recommendation
HighRiskLow
SellRecommendationBuy
Log in to see the recommendation and risk by Inderes
Latest research
Extensive report
Inderes' extensive report is an investor's handbook on customer companies covered by our research.
The latest extensive report was released
Read the reportAnalyst

Rauli Juva
Analyst
Financial calendar
General meeting
03.05.2024
Half year dividend
06.05.2024
Interim report
27.06.2024
Interim report
26.09.2024
Half year dividend
07.11.2024
Major OwnersSource: Millistream Market Data AB
| Owner | Capital | Votes |
|---|---|---|
| Stefan Persson and family | 57.6 % | 79.6 % |
| Lottie Tham | 5.4 % | 2.6 % |
Premium
This content is for our Premium customers only.
Forum updates
Income statement
| 2020 | 2021 | 2022 | 2023 | 2024e | 2025e | 2026e | 2027e | |
|---|---|---|---|---|---|---|---|---|
| Revenue | 187,031.0 | 198,967.0 | 223,553.0 | 236,035.0 | 237,069.0 | 247,555.0 | 259,558.0 | 272,536.0 |
| growth-% | -19.6 % | 6.4 % | 12.4 % | 5.6 % | 0.4 % | 4.4 % | 4.8 % | 5.0 % |
| EBITDA | 29,052.0 | 37,575.0 | 29,748.0 | 37,492.0 | 42,640.4 | 46,434.8 | 47,590.6 | 48,870.7 |
| EBIT (adj.) | 3,099.0 | 15,255.0 | 9,760.0 | 13,538.0 | 20,737.4 | 23,718.9 | 24,822.6 | 25,890.9 |
| EBIT | 3,099.0 | 15,255.0 | 7,169.0 | 14,537.0 | 20,737.4 | 23,718.9 | 24,822.6 | 25,890.9 |
| Profit before taxes | 2,052.0 | 14,300.0 | 6,216.0 | 13,010.0 | 18,916.4 | 22,218.9 | 23,622.6 | 25,390.9 |
| Net income | 1,243.0 | 11,010.0 | 3,566.0 | 8,723.0 | 14,183.8 | 16,775.3 | 17,835.0 | 19,170.1 |
| EPS (adj.) | 0.75 | 6.65 | 3.74 | 4.73 | 8.81 | 10.42 | 11.07 | 11.90 |
| growth-% | -90.8 % | 785.8 % | -43.8 % | 26.4 % | 86.3 % | 18.3 % | 6.3 % | 7.5 % |
| Dividend | 0.00 | 6.50 | 6.50 | 6.50 | 7.00 | 7.50 | 8.50 | 11.90 |
| Dividend ratio | 97.7 % | 299.8 % | 120.9 % | 79.5 % | 72.0 % | 76.8 % | 100.0 % |
Login required
This content is only available for logged in users
Profitability and return on capital
| 2020 | 2021 | 2022 | 2023 | 2024e | 2025e | 2026e | 2027e | |
|---|---|---|---|---|---|---|---|---|
| EBITDA-% | 15.5 % | 18.9 % | 13.3 % | 15.9 % | 18.0 % | 18.8 % | 18.3 % | 17.9 % |
| EBIT-% (adj.) | 1.7 % | 7.7 % | 4.4 % | 5.7 % | 8.7 % | 9.6 % | 9.6 % | 9.5 % |
| EBIT-% | 1.7 % | 7.7 % | 3.2 % | 6.2 % | 8.7 % | 9.6 % | 9.6 % | 9.5 % |
| ROE | 2.2 % | 19.2 % | 6.4 % | 17.7 % | 28.7 % | 31.1 % | 29.9 % | 29.4 % |
| ROI | 3.0 % | 11.7 % | 5.7 % | 11.7 % | 16.5 % | 18.7 % | 19.6 % | 20.2 % |
Login required
This content is only available for logged in users
Valuation
| 2020 | 2021 | 2022 | 2023 | 2024e | 2025e | 2026e | 2027e | |
|---|---|---|---|---|---|---|---|---|
| Share price (SEK) | 172.00 | 178.08 | 112.24 | 176.62 | 181.75 | 181.75 | 181.75 | 181.75 |
| Shares | 1,655.1 | 1,655.1 | 1,645.0 | 1,622.0 | 1,610.5 | 1,610.5 | 1,610.5 | 1,610.5 |
| Market cap | 284,672.0 | 294,734.9 | 184,634.8 | 286,477.6 | 292,708.4 | 292,708.4 | 292,708.4 | 292,708.4 |
| Enterprise value | 348,197.0 | 333,954.9 | 235,562.8 | 338,049.6 | 345,568.9 | 343,766.8 | 342,597.9 | 342,381.2 |
| EV/S | 1.9 | 1.7 | 1.1 | 1.4 | 1.5 | 1.4 | 1.3 | 1.3 |
| EV/EBITDA | 12.0 | 8.9 | 7.9 | 9.0 | 8.1 | 7.4 | 7.2 | 7.0 |
| EV/EBIT (adj.) | 112.4 | 21.9 | 24.1 | 25.0 | 16.7 | 14.5 | 13.8 | 13.2 |
| EV/EBIT | 112.4 | 21.9 | 32.9 | 23.3 | 16.7 | 14.5 | 13.8 | 13.2 |
| P/E (adj.) | 229.0 | 26.8 | 30.0 | 37.4 | 20.6 | 17.4 | 16.4 | 15.3 |
| P/E | 229.0 | 26.8 | 51.8 | 33.1 | 20.6 | 17.4 | 16.4 | 15.3 |
| P/B | 5.2 | 4.9 | 3.6 | 6.0 | 5.7 | 5.2 | 4.7 | 4.3 |
| P/S | 1.5 | 1.5 | 0.8 | 1.2 | 1.2 | 1.2 | 1.1 | 1.1 |
| Dividend yield | 3.7 % | 5.8 % | 3.7 % | 3.9 % | 4.1 % | 4.7 % | 6.6 % | |
| Equity ratio | 31.3 % | 33.4 % | 27.9 % | 26.3 % | 28.7 % | 31.2 % | 34.6 % | 36.2 % |
| Gearing ratio | 116.3 % | 65.3 % | 100.3 % | 108.3 % | 103.2 % | 90.0 % | 79.8 % | 73.1 % |
Login required
This content is only available for logged in users
Quarter data
| Q1/23 | Q2/23 | Q3/23 | Q4/23 | 2023 | Q1/24e | Q2/24e | Q3/24e | Q4/24e | |
|---|---|---|---|---|---|---|---|---|---|
| Revenue | 54,872.0 | 57,616.0 | 60,897.0 | 62,650.0 | 236,035.0 | 53,669.0 | 58,000.0 | 61,500.0 | 63,900.0 |
| EBITDA | 6,230.0 | 10,234.0 | 10,466.0 | 10,562.0 | 37,492.0 | 7,480.0 | 11,530.0 | 12,080.0 | 11,550.4 |
| EBIT | 725.0 | 4,741.0 | 4,739.0 | 4,332.0 | 14,537.0 | 2,077.0 | 6,030.0 | 6,580.0 | 6,050.4 |
| Profit before taxes | 396.0 | 4,325.0 | 4,373.0 | 3,916.0 | 13,010.0 | 1,606.0 | 5,580.0 | 6,130.0 | 5,600.4 |
| Net income | 540.0 | 3,288.0 | 3,319.0 | 1,576.0 | 8,723.0 | 1,201.0 | 4,185.0 | 4,597.5 | 4,200.3 |
Login required
This content is only available for logged in users
ShowingAll content types

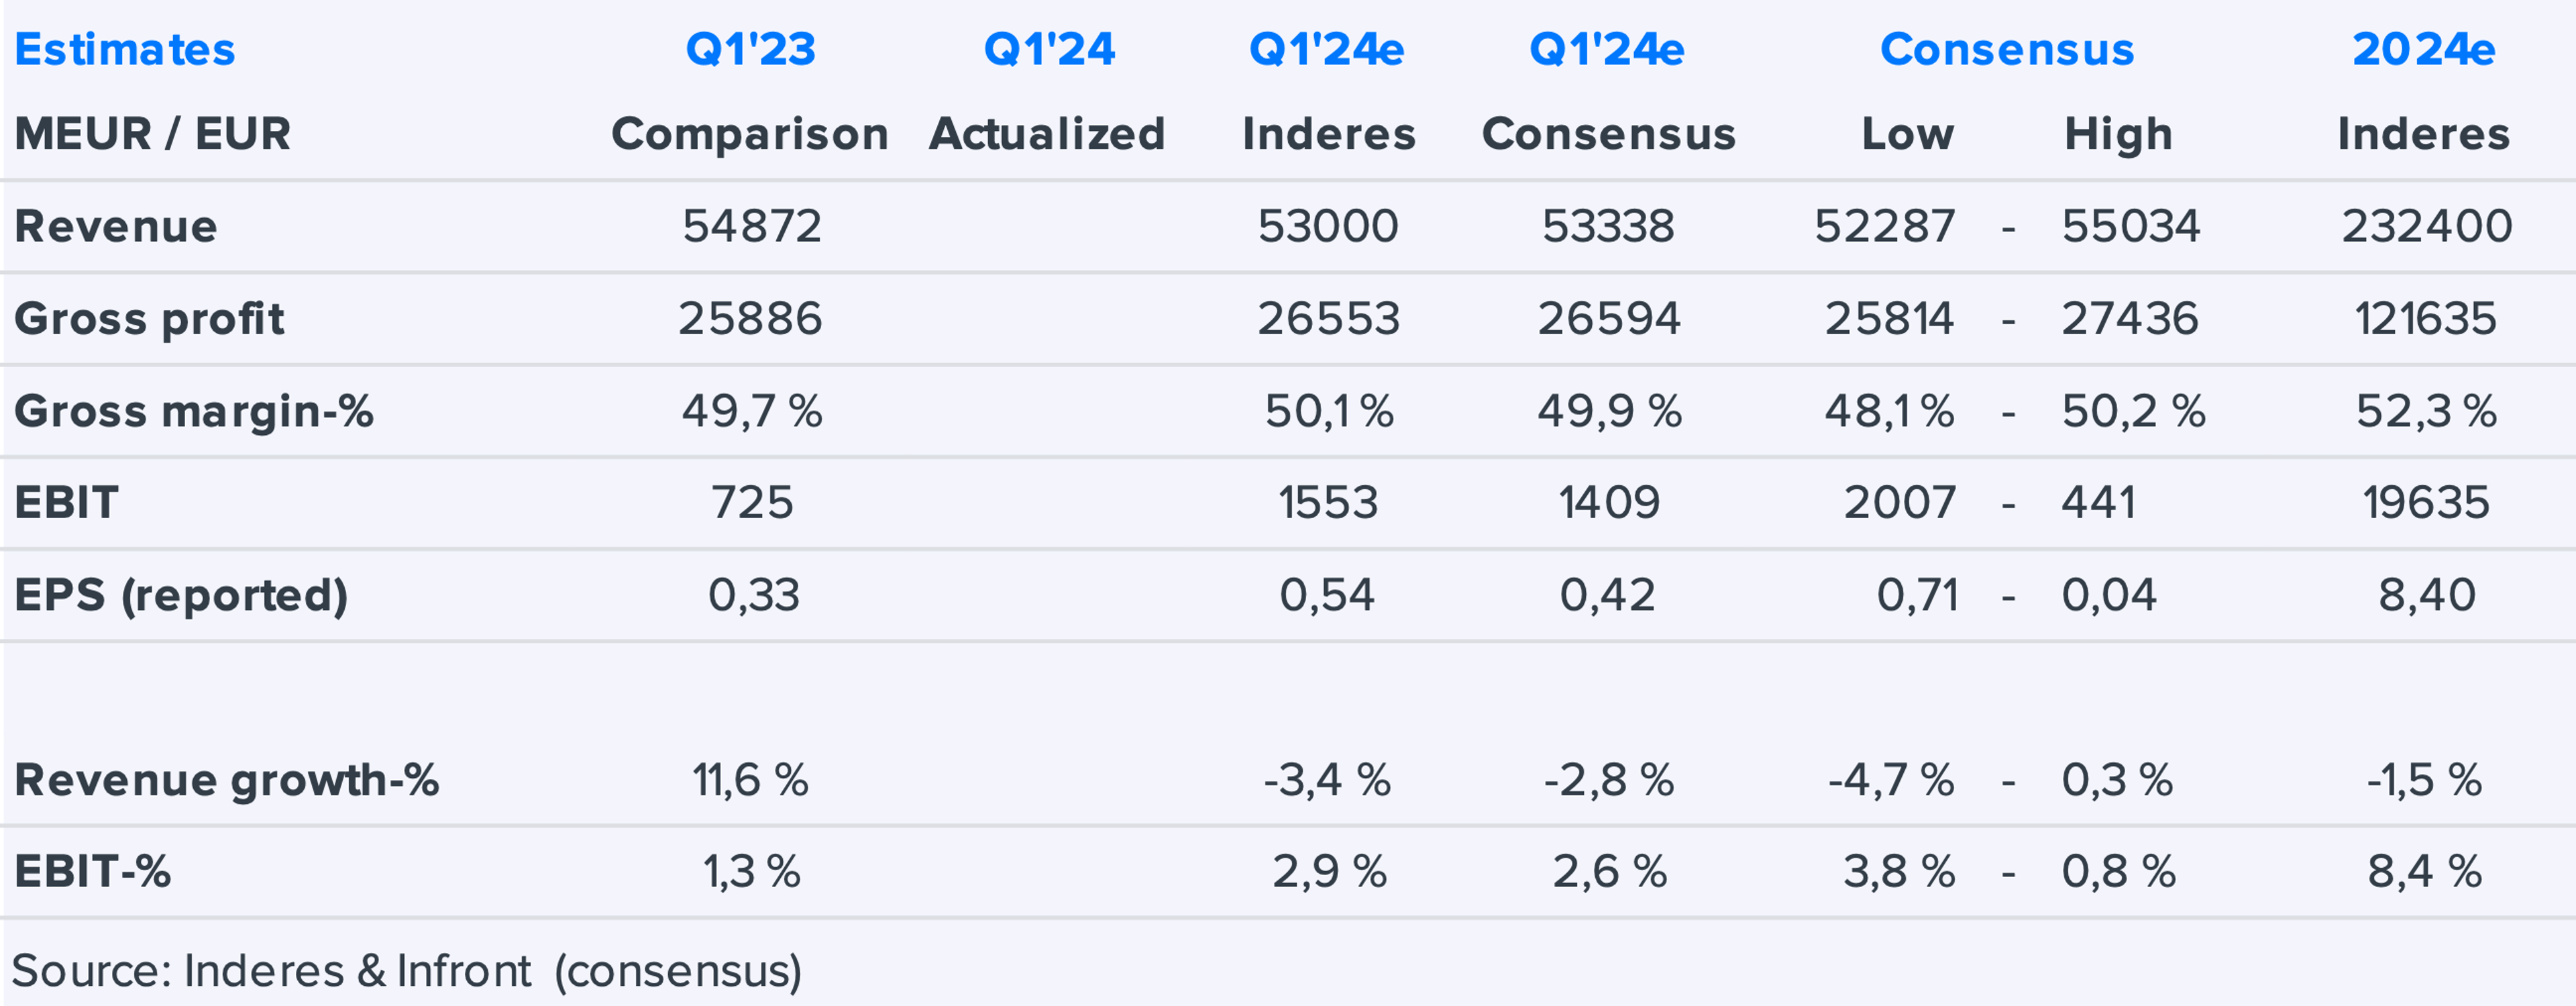
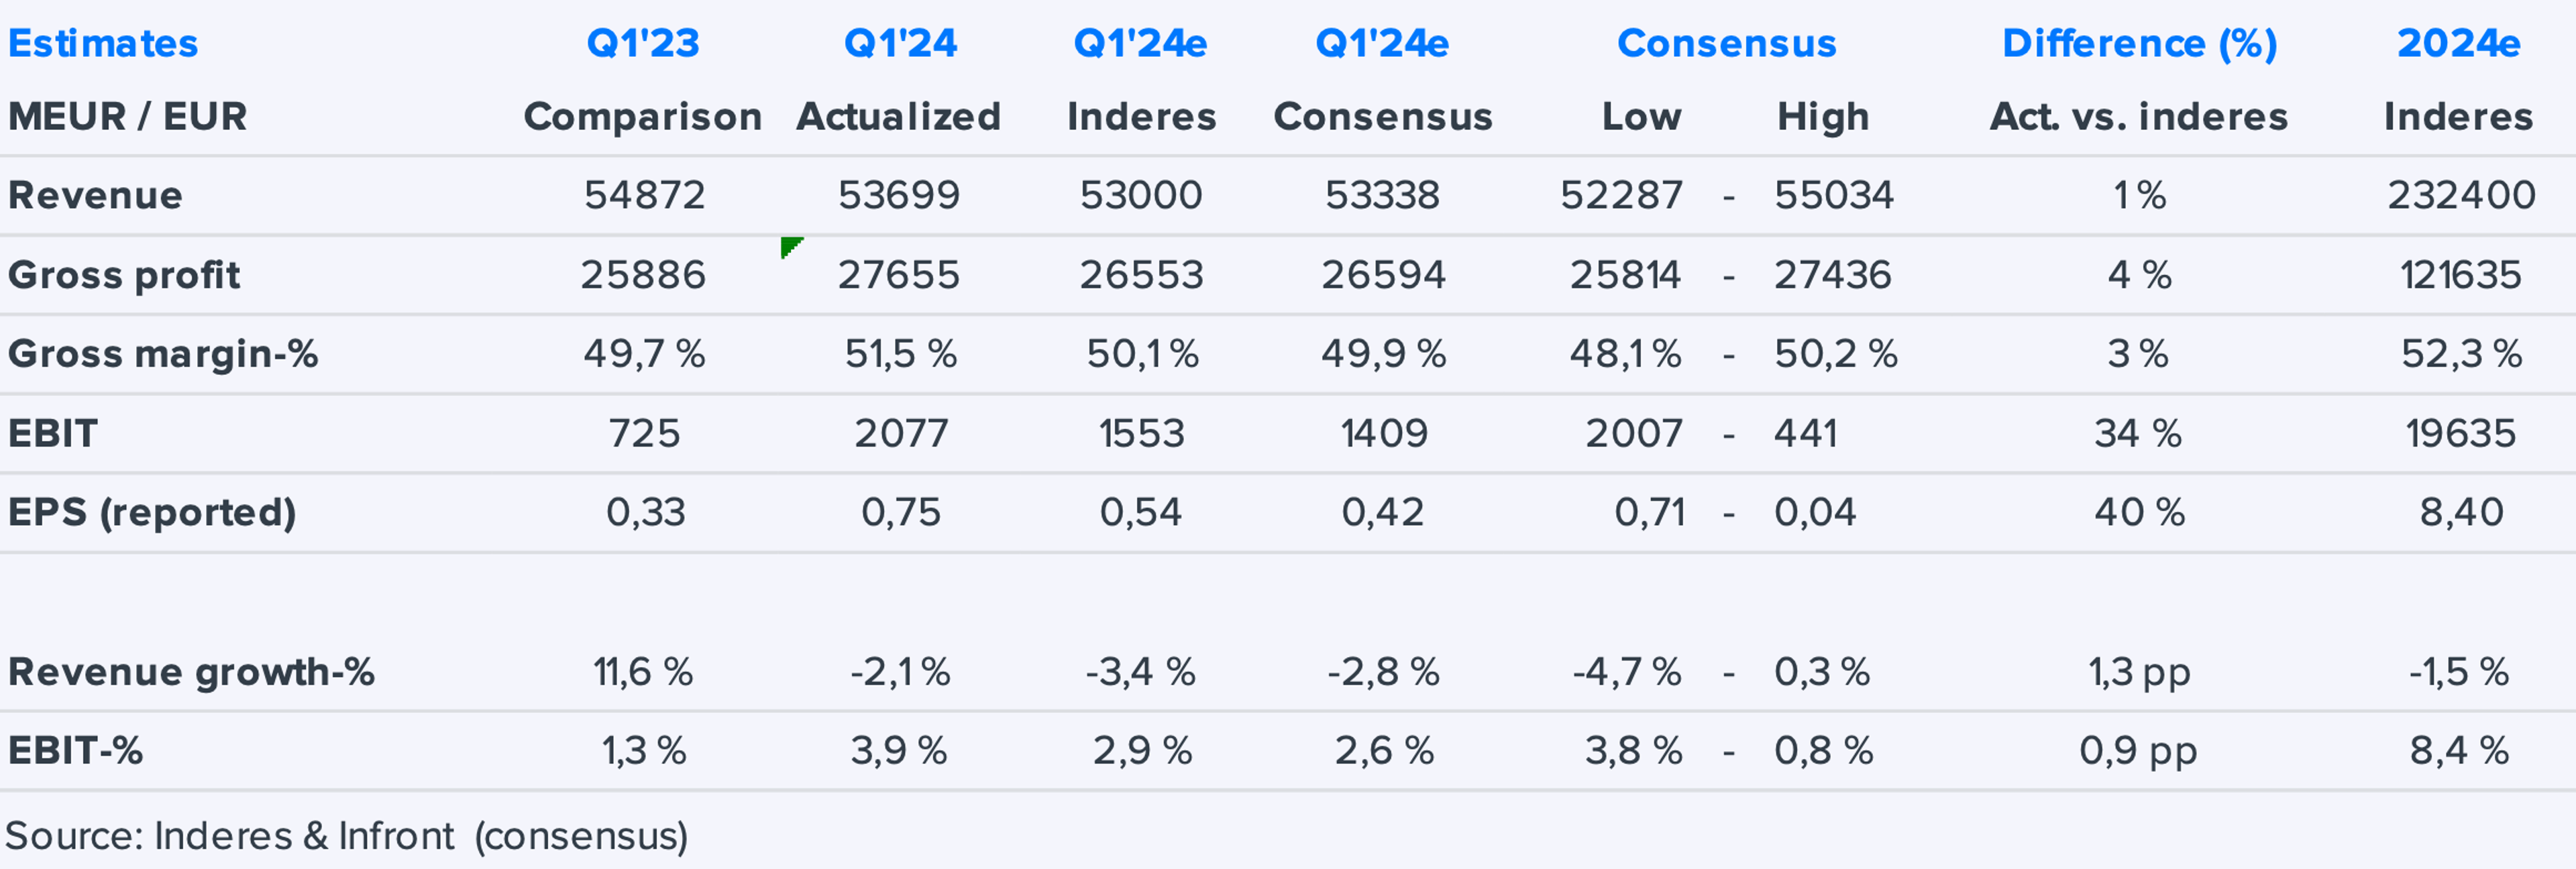
H&M Q1: Ahead of expectations thanks to strong gross margin
H & M Hennes & Mauritz AB: H&M's nomination committee proposes Helena Saxon as new board member
Join Inderes community
Don't miss out - create an account and get all the possible benefits
FREE account
Stock market's most popular morning newsletter
Analyst comments and recommendations
Stock comparison tool
PREMIUM account
All company reports and content
Premium tools (e.g. insider transactions & stock screener)
Model portfolio