Log in to your Inderes Free account to see all free content on this page.
Innofactor
1.29 EUR +0.39%6,241 investors are following this company
Innofactor operates in the IT sector. The company is focused on offering services in digitization and cloud-based solutions. Examples of business areas include sales, marketing and communication, business intelligence, and CRM (Customer Relationship Management). The largest presence is found in the Nordic market and customers consist of small and medium-sized corporate customers. The head office is located in Espoo.
P/E (24e)
9.26
EV/EBIT (adj.) (24e)
7.5
EV/S (24e)
0.61
Dividend yield-% (24e)
6.2 %
Target price
1.55 EUR
Recommendation
Buy
Updated
8.2.2024
NASDAQ Helsinki
IFA1V
Daily low / high price
1.27 / 1.295
EUR
Market cap
46.88M EUR
Turnover
7.04K EUR
Volume
5.5K
Risk and recommendation
HighRiskLow
SellRecommendationBuy
Log in to see the recommendation and risk by Inderes
Latest research
Extensive report
Inderes' extensive report is an investor's handbook on customer companies covered by our research.
The latest extensive report was released
Read the reportAnalyst

Joni Grönqvist
Analyst
Latest videos
Financial calendar
Interim report
23.04.2024
Interim report
18.07.2024
Interim report
22.10.2024
Major OwnersSource: Millistream Market Data AB
| Owner | Capital | Votes |
|---|---|---|
| Ensio Sami | 21.8 % | 21.8 % |
| Ilmarinen Mutual Pension Insurance Company | 5.0 % | 5.0 % |
Premium
This content is for our Premium customers only.
Insider Transactions
| Insider | Date | Total value |
|---|---|---|
| Vesa Syrjäkari | 26.05.2023 | 63,734EUR |
| Vesa Syrjäkari | 25.05.2023 | 8,334EUR |
Premium
This content is for our Premium customers only.
Forum updates
Income statement
| 2020 | 2021 | 2022 | 2023 | 2024e | 2025e | 2026e | 2027e | |
|---|---|---|---|---|---|---|---|---|
| Revenue | 66.2 | 66.4 | 71.1 | 80.3 | 84.5 | 88.5 | 92.1 | 95.0 |
| growth-% | 3.1 % | 0.3 % | 7.2 % | 12.8 % | 5.3 % | 4.8 % | 4.1 % | 3.1 % |
| EBITDA | 7.2 | 10.1 | 7.8 | 9.1 | 9.9 | 10.7 | 11.1 | 11.5 |
| EBIT (adj.) | 4.5 | 4.4 | 5.0 | 6.0 | 6.9 | 7.9 | 8.2 | 8.4 |
| EBIT | 2.5 | 6.5 | 4.8 | 5.8 | 6.9 | 7.7 | 8.0 | 8.4 |
| Profit before taxes | 2.1 | 5.7 | 4.2 | 5.2 | 6.2 | 7.4 | 8.0 | 8.4 |
| Net income | 1.8 | 4.5 | 3.3 | 3.4 | 5.0 | 5.9 | 6.3 | 6.7 |
| EPS (adj.) | 0.10 | 0.07 | 0.10 | 0.10 | 0.14 | 0.17 | 0.18 | 0.19 |
| growth-% | 51.2 % | -35.1 % | 49.8 % | 3.0 % | 38.3 % | 21.2 % | 7.8 % | 2.9 % |
| Dividend | 0.04 | 0.08 | 0.06 | 0.07 | 0.08 | 0.09 | 0.10 | 0.10 |
| Dividend ratio | 84.9 % | 65.1 % | 65.4 % | 72.8 % | 57.5 % | 54.8 % | 56.4 % | 53.4 % |
Login required
This content is only available for logged in users
Profitability and return on capital
| 2020 | 2021 | 2022 | 2023 | 2024e | 2025e | 2026e | 2027e | |
|---|---|---|---|---|---|---|---|---|
| EBITDA-% | 10.8 % | 15.2 % | 11.0 % | 11.3 % | 11.7 % | 12.0 % | 12.1 % | 12.1 % |
| EBIT-% (adj.) | 6.8 % | 6.6 % | 7.1 % | 7.5 % | 8.1 % | 8.9 % | 8.9 % | 8.8 % |
| EBIT-% | 3.8 % | 9.8 % | 6.7 % | 7.3 % | 8.1 % | 8.7 % | 8.7 % | 8.8 % |
| ROE | 7.7 % | 18.4 % | 13.2 % | 13.7 % | 18.6 % | 19.9 % | 19.5 % | 18.8 % |
| ROI | 6.9 % | 17.7 % | 12.8 % | 15.8 % | 19.4 % | 21.6 % | 23.2 % | 23.6 % |
Login required
This content is only available for logged in users
Valuation
| 2020 | 2021 | 2022 | 2023 | 2024e | 2025e | 2026e | 2027e | |
|---|---|---|---|---|---|---|---|---|
| Share price (EUR) | 1.28 | 1.52 | 1.05 | 1.23 | 1.29 | 1.29 | 1.29 | 1.29 |
| Shares | 37.4 | 36.6 | 36.2 | 35.7 | 35.7 | 35.7 | 35.7 | 35.7 |
| Market cap | 47.7 | 55.5 | 38.1 | 43.8 | 46.1 | 46.1 | 46.1 | 46.1 |
| Enterprise value | 60.0 | 63.3 | 50.5 | 53.0 | 51.4 | 47.0 | 42.3 | 39.3 |
| EV/S | 0.9 | 1.0 | 0.7 | 0.7 | 0.6 | 0.5 | 0.5 | 0.4 |
| EV/EBITDA | 8.4 | 6.3 | 6.5 | 5.8 | 5.2 | 4.4 | 3.8 | 3.4 |
| EV/EBIT (adj.) | 13.3 | 14.4 | 10.0 | 8.8 | 7.5 | 6.0 | 5.1 | 4.7 |
| EV/EBIT | 24.0 | 9.7 | 10.6 | 9.1 | 7.5 | 6.1 | 5.3 | 4.7 |
| P/E (adj.) | 12.7 | 23.2 | 10.8 | 12.2 | 9.3 | 7.6 | 7.1 | 6.9 |
| P/E | 27.1 | 12.3 | 11.5 | 12.7 | 9.3 | 7.9 | 7.3 | 6.9 |
| P/B | 2.0 | 2.2 | 1.5 | 1.7 | 1.6 | 1.5 | 1.4 | 1.2 |
| P/S | 0.7 | 0.8 | 0.5 | 0.5 | 0.5 | 0.5 | 0.5 | 0.5 |
| Dividend yield | 3.1 % | 5.3 % | 5.7 % | 5.7 % | 6.2 % | 7.0 % | 7.8 % | 7.8 % |
| Equity ratio | 41.4 % | 49.9 % | 44.4 % | 46.8 % | 51.2 % | 56.3 % | 62.7 % | 64.1 % |
| Gearing ratio | 52.6 % | 30.8 % | 50.0 % | 36.1 % | 19.1 % | 2.9 % | -11.1 % | -18.3 % |
Login required
This content is only available for logged in users
Quarter data
| Q1/23 | Q2/23 | Q3/23 | Q4/23 | 2023 | Q1/24e | Q2/24e | Q3/24e | Q4/24e | |
|---|---|---|---|---|---|---|---|---|---|
| Revenue | 20.2 | 20.1 | 18.0 | 21.9 | 80.3 | 21.4 | 21.2 | 18.9 | 23.0 |
| EBITDA | 2.5 | 1.8 | 2.0 | 2.9 | 9.1 | 2.5 | 2.2 | 2.2 | 3.0 |
| EBIT | 1.7 | 1.0 | 1.2 | 1.9 | 5.8 | 1.7 | 1.4 | 1.4 | 2.3 |
| Profit before taxes | 1.3 | 0.8 | 1.4 | 1.6 | 5.2 | 1.6 | 1.3 | 1.3 | 2.1 |
| Net income | 1.0 | 0.5 | 1.1 | 0.9 | 3.4 | 1.2 | 1.0 | 1.0 | 1.7 |
Login required
This content is only available for logged in users
ShowingAll content types

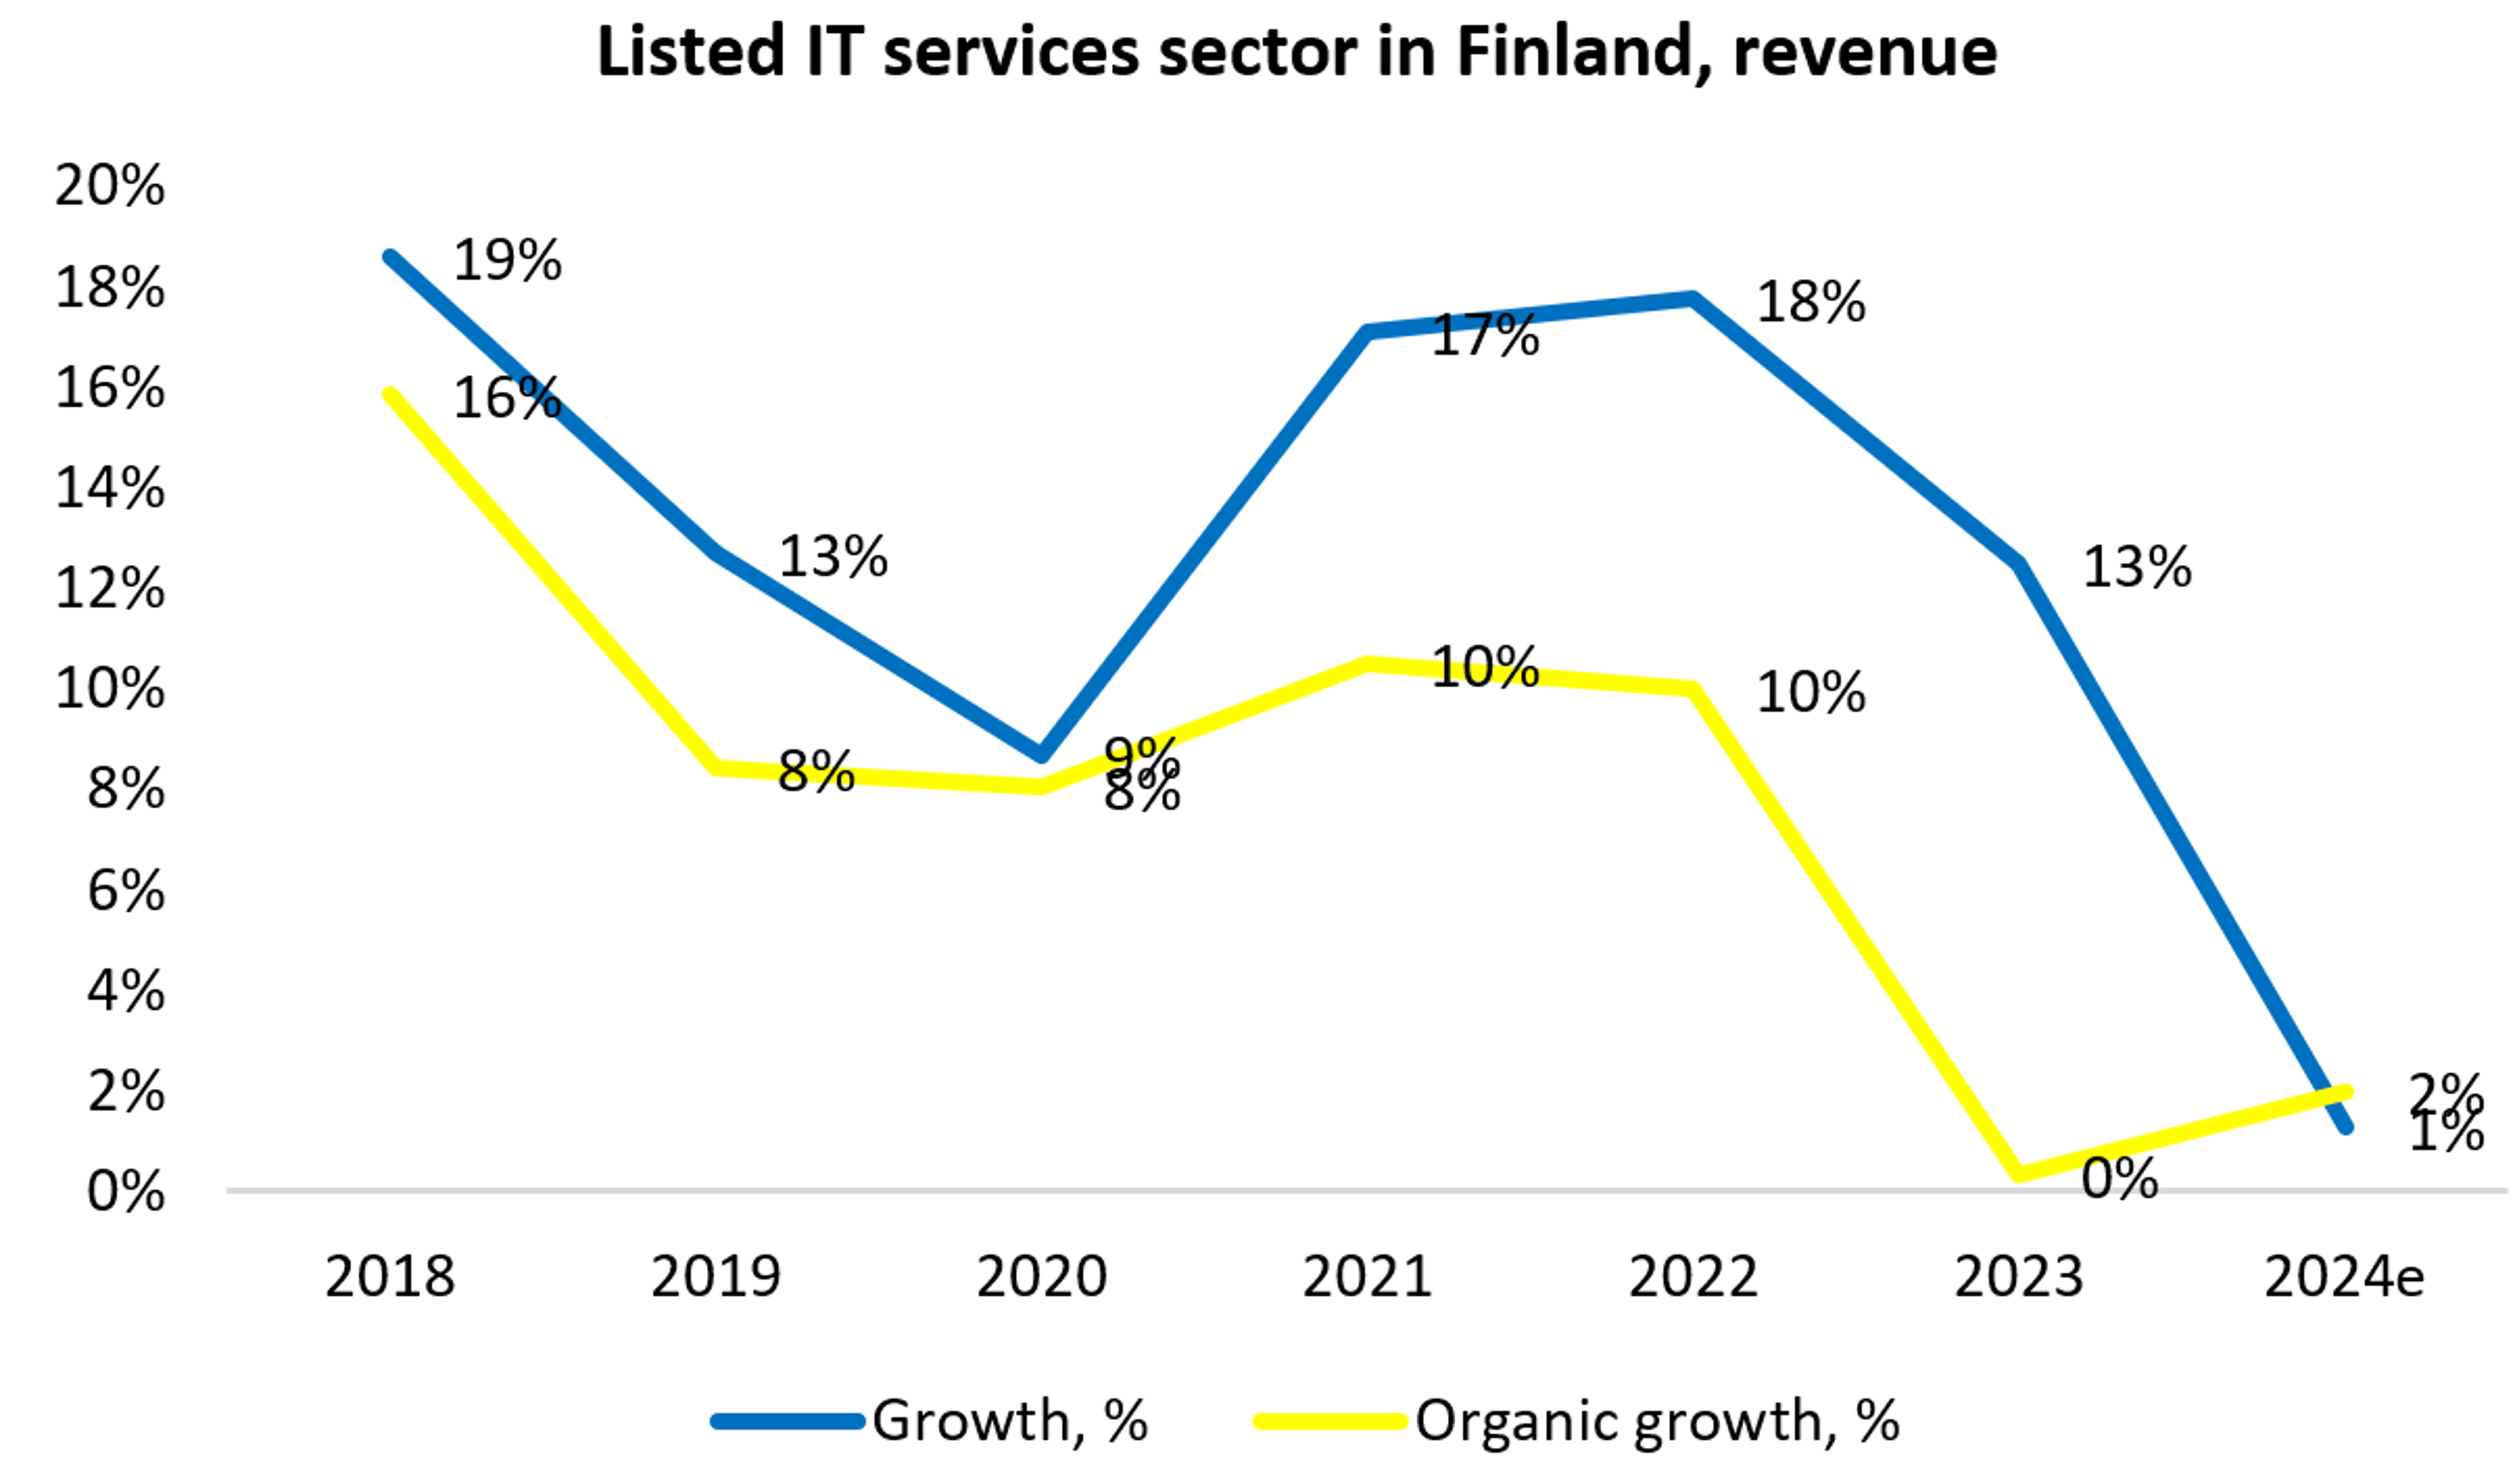
IT service sector: Our expectations for 2024 generally at the lower end of companies' guidance
Decisions of Innofactor Plc’s Annual General Meeting and the organizing meeting of the Board of Directors
Join Inderes community
Don't miss out - create an account and get all the possible benefits
FREE account
Stock market's most popular morning newsletter
Analyst comments and recommendations
Stock comparison tool
PREMIUM account
All company reports and content
Premium tools (e.g. insider transactions & stock screener)
Model portfolio