Log in to your Inderes Free account to see all free content on this page.
Vincit
2.61 EUR +0.77%8,199 investors are following this company
Vincit provides services in design and software development. The services include, for example, software for e-commerce and web applications, cloud platforms, mobile applications and IoT solutions. The services are used by both small and medium-sized corporate customers. The main operations are in Europe and North America. Vincit was founded in 2007 and is headquartered in Finland.
P/E (24e)
13.87
EV/EBIT (adj.) (24e)
7.6
EV/S (24e)
0.35
Dividend yield-% (24e)
5.75 %
Target price
3.10 EUR
Recommendation
Accumulate
Updated
25.4.2024
First North Finland
VINCIT
Daily low / high price
2.6 / 2.68
EUR
Market cap
44.25M EUR
Turnover
48.94K EUR
Volume
19K
Business risk
Valuation risk
Current
Previous
Analyst

Joni Grönqvist
Analyst
Financial calendar
Business review
25.04.2024
Interim report
18.07.2024
Business review
24.10.2024
Major OwnersSource: Millistream Market Data AB
| Owner | Capital | Votes |
|---|---|---|
| Kuitunen Mikko Antti Mikael | 7.7 % | 7.7 % |
| Bcore Oy | 7.1 % | 7.1 % |
Premium
This content is for our Premium customers only.
Insider Transactions
| Insider | Date | Total value |
|---|---|---|
| Kimmo Kärkkäinen | 12.12.2023 | 59,600EUR |
| Julius Manni | 12.12.2023 | 21,331EUR |
Premium
This content is for our Premium customers only.
Forum updates
Income statement
| 2020 | 2021 | 2022 | 2023 | 2024e | 2025e | 2026e | 2027e | |
|---|---|---|---|---|---|---|---|---|
| Revenue | 52.4 | 61.5 | 84.8 | 98.1 | 90.6 | 96.4 | 103.8 | 110.0 |
| growth-% | 8.7 % | 17.4 % | 37.9 % | 15.7 % | -7.7 % | 6.4 % | 7.7 % | 6.0 % |
| EBITDA | 8.2 | 6.5 | 3.6 | 2.0 | 5.1 | 6.6 | 7.9 | 8.8 |
| EBIT (adj.) | 7.6 | 5.1 | 5.2 | 3.4 | 4.2 | 5.8 | 7.0 | 7.8 |
| EBIT | 6.0 | 4.1 | 0.2 | -2.2 | 1.0 | 2.6 | 3.8 | 4.8 |
| Profit before taxes | 5.8 | 4.8 | 0.2 | -2.5 | 1.1 | 2.8 | 4.0 | 5.0 |
| Net income | 4.4 | 3.5 | -0.3 | -2.9 | -0.1 | 1.3 | 2.2 | 3.1 |
| EPS (adj.) | 0.50 | 0.40 | 0.32 | 0.16 | 0.19 | 0.27 | 0.33 | 0.37 |
| growth-% | 131.6 % | -19.7 % | -20.7 % | -49.4 % | 17.6 % | 44.0 % | 21.1 % | 12.1 % |
| Dividend | 0.18 | 0.20 | 0.15 | 0.10 | 0.15 | 0.17 | 0.20 | 0.22 |
| Dividend ratio | 49.7 % | 70.4 % | -893.7 % | -57.8 % | -2,963.8 % | 218.6 % | 148.3 % | 117.9 % |
Login required
This content is only available for logged in users
Profitability and return on capital
| 2020 | 2021 | 2022 | 2023 | 2024e | 2025e | 2026e | 2027e | |
|---|---|---|---|---|---|---|---|---|
| EBITDA-% | 15.6 % | 10.5 % | 4.3 % | 2.0 % | 5.7 % | 6.8 % | 7.6 % | 8.0 % |
| EBIT-% (adj.) | 14.5 % | 8.3 % | 6.1 % | 3.4 % | 4.6 % | 6.0 % | 6.7 % | 7.1 % |
| EBIT-% | 11.4 % | 6.7 % | 0.3 % | -2.3 % | 1.1 % | 2.7 % | 3.7 % | 4.4 % |
| ROE | 19.0 % | 13.6 % | -0.8 % | -7.4 % | -0.2 % | 3.8 % | 6.8 % | 9.5 % |
| ROI | 24.3 % | 15.4 % | 0.7 % | -5.7 % | 3.2 % | 8.3 % | 12.2 % | 15.1 % |
Login required
This content is only available for logged in users
Valuation
| 2020 | 2021 | 2022 | 2023 | 2024e | 2025e | 2026e | 2027e | |
|---|---|---|---|---|---|---|---|---|
| Share price (EUR) | 7.18 | 8.02 | 4.16 | 3.23 | 2.61 | 2.61 | 2.61 | 2.61 |
| Shares | 12.1 | 12.2 | 16.5 | 16.6 | 16.6 | 16.6 | 16.6 | 16.6 |
| Market cap | 86.7 | 98.1 | 68.7 | 53.5 | 43.2 | 43.2 | 43.2 | 43.2 |
| Enterprise value | 77.0 | 89.5 | 58.5 | 41.4 | 31.6 | 30.5 | 28.7 | 26.5 |
| EV/S | 1.5 | 1.5 | 0.7 | 0.4 | 0.3 | 0.3 | 0.3 | 0.2 |
| EV/EBITDA | 9.4 | 13.9 | 16.2 | 21.2 | 6.2 | 4.6 | 3.6 | 3.0 |
| EV/EBIT (adj.) | 10.2 | 17.5 | 11.3 | 12.3 | 7.6 | 5.2 | 4.1 | 3.4 |
| EV/EBIT | 12.9 | 21.8 | 248.9 | - | 32.8 | 11.7 | 7.6 | 5.5 |
| P/E (adj.) | 14.5 | 20.1 | 13.2 | 20.2 | 13.9 | 9.6 | 8.0 | 7.1 |
| P/E | 19.8 | 28.2 | - | - | - | 33.6 | 19.4 | 14.0 |
| P/B | 3.5 | 3.7 | 1.7 | 1.5 | 1.3 | 1.3 | 1.3 | 1.3 |
| P/S | 1.7 | 1.6 | 0.8 | 0.5 | 0.5 | 0.4 | 0.4 | 0.4 |
| Dividend yield | 2.5 % | 2.5 % | 3.6 % | 3.1 % | 5.8 % | 6.5 % | 7.7 % | 8.4 % |
| Equity ratio | 72.6 % | 70.2 % | 67.0 % | 63.4 % | 65.5 % | 63.3 % | 61.1 % | 57.4 % |
| Gearing ratio | -38.3 % | -31.6 % | -24.5 % | -33.4 % | -33.6 % | -38.3 % | -44.5 % | -51.5 % |
Login required
This content is only available for logged in users
Quarter data
| Q2/23 | Q3/23 | Q4/23 | 2023 | Q1/24 | Q2/24e | Q3/24e | Q4/24e | 2024e | |
|---|---|---|---|---|---|---|---|---|---|
| Revenue | 52.8 | 45.3 | 98.1 | 23.0 | 22.4 | 20.3 | 24.9 | 90.6 | |
| EBITDA | 2.3 | -0.4 | 2.0 | 0.8 | 1.1 | 1.3 | 1.9 | 5.1 | |
| EBIT | 0.3 | -2.5 | -2.2 | -0.3 | 0.1 | 0.3 | 0.9 | 1.0 | |
| Profit before taxes | 0.1 | -2.6 | -2.5 | -0.2 | 0.2 | 0.3 | 0.9 | 1.1 | |
| Net income | -0.3 | -2.6 | -2.9 | -0.4 | -0.1 | -0.0 | 0.5 | -0.1 |
Login required
This content is only available for logged in users
ShowingAll content types

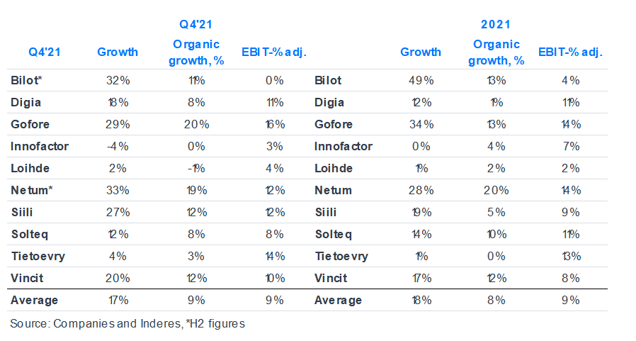
Q4 IT service sector summary: Growth and profitability in line with our expectations, 2023 can be seen as a defensive win
IT service sector valuation levels at the bottom of our 7-year monitoring history, justifiably?
Join Inderes community
Don't miss out - create an account and get all the possible benefits
FREE account
Stock market's most popular morning newsletter
Analyst comments and recommendations
Stock comparison tool
PREMIUM account
All company reports and content
Premium tools (e.g. insider transactions & stock screener)
Model portfolio
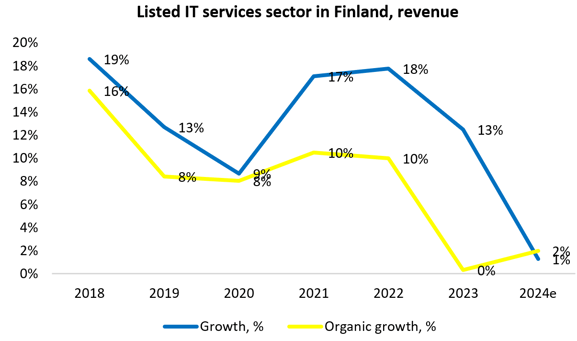
We expect the IT services sector to grow moderately and profitability to increase slightly in 2024
IT services sector Q3 summary: Better than feared with several areas continuing to perform well
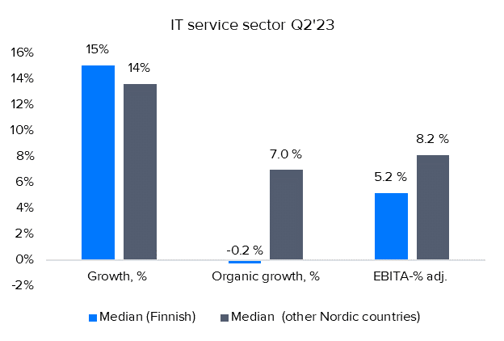
IT service sector: Fast deceleration in figures in Q2 in Finland, better in other Nordic countries
IT service sector: Mainly a strong start to the year
Case: Cost structures and profitability of expert companies
IT service sector Q2 summary: Strong organic growth dimmed by profitability challenges
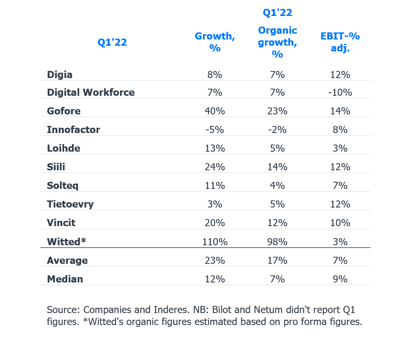
IT service sector Q1 summary: Great start for the year with rest of the year looking good
Vincit Oyj: Vincit USA Names New Head of Sales, Former HP Sales Director Harry Ollikainen