Log in to your Inderes Free account to see all free content on this page.
Siili Solutions
8,98 EUR −3,44%7 814 investerare följer bolaget.
Siili Solutions är verksamt inom IT-sektorn. Bolaget utvecklar och integrerar programvara för informationssystem. Idag erbjuds tjänster relaterade till utveckling av teknikplattformar, informationshantering, IT-arkitektur, samt diverse projektledningar. Kompetensen återfinns datahantering, analys samt artificiell intelligens. Bolaget grundades 2005 och har sitt huvudkontor i Helsingfors.
P/E (24e)
11,41
EV/EBIT (adj.) (24e)
8,04
EV/S (24e)
0,6
Direktavkastnings- % (24e)
3,34 %
Riktkurs
11.50 EUR
Rekommendation
Öka
Uppdaterad
27.2.2024
NASDAQ Helsinki
SIILI
Dagens lägsta / högsta pris
8,84 / 9,16
EUR
Börsvärde
73,1 mn EUR
Omsatt (värde)
32,46 tn EUR
Omsatt (antal)
3,6 tn
Risk och rekommendation
HögRiskLåg
SäljRekommendationKöp
Log in to see the recommendation and risk by Inderes
Senaste analyserna
Extensive report
Inderes' extensive report is an investor's handbook on customer companies covered by our research.
The latest extensive report was released
Read the reportAnalyst

Joni Grönqvist
Analyst
Senast publicerade videor
Finansiell kalender
Business review
24.04.2024
Delårsrapport
13.08.2024
Business review
22.10.2024
Största ägareKälla: Millistream Market Data AB
| Ägare | Kapital | Röster |
|---|---|---|
| Lamy Oy | 16,0 % | 16,0 % |
| Ilmarinen Mutual Pension Insurance Company | 7,5 % | 7,5 % |
Premium
Innehållet är endast tillgängligt för våra Premium-kunder.
Insider Transactions
| Insider | Date | Total value |
|---|---|---|
| Kenneth Lindfors | 01.03.2024 | 593EUR |
| Taru Salo | 01.03.2024 | 9EUR |
Premium
Innehållet är endast tillgängligt för våra Premium-kunder.
Forum uppdateringar
Håll dig uppdaterad med de senaste diskussionerna om Siili Solutions
Toimitusjohtaja Tomi Pienimäen katsaus tämän päivän yhtiökokouksesta.
2024-04-03 13:01💙 9
Resultaträkning
| 2020 | 2021 | 2022 | 2023 | 2024e | 2025e | 2026e | 2027e | |
|---|---|---|---|---|---|---|---|---|
| Omsättning | 83,3 | 99,3 | 118,3 | 122,7 | 121,7 | 128,0 | 137,4 | 142,9 |
| tillväxt-% | 3,4 % | 19,2 % | 19,2 % | 3,7 % | −0,8 % | 5,2 % | 7,4 % | 4,0 % |
| EBITDA | 9,1 | 12,0 | 14,9 | 12,1 | 12,8 | 13,8 | 15,2 | 16,0 |
| EBIT (adj.) | 6,7 | 9,3 | 11,6 | 8,7 | 9,0 | 10,0 | 11,3 | 10,7 |
| EBIT | 5,3 | 7,6 | 10,1 | 6,9 | 7,7 | 8,7 | 10,0 | 10,7 |
| Vinst före skatt | 6,3 | 6,4 | 5,4 | 5,5 | 6,6 | 7,9 | 9,4 | 10,4 |
| Nettoresultat | 4,4 | 5,1 | 3,7 | 5,0 | 5,1 | 6,2 | 7,4 | 8,2 |
| EPS (adj.) | 0,78 | 0,93 | 1,01 | 0,66 | 0,79 | 0,92 | 1,07 | 1,02 |
| tillväxt-% | 47,2 % | 19,4 % | 8,8 % | −35,0 % | 20,1 % | 17,3 % | 16,1 % | −5,2 % |
| Utdelning | 0,28 | 0,18 | 0,20 | 0,26 | 0,30 | 0,35 | 0,40 | 0,45 |
| Utdelningskvot | 44,5 % | 24,6 % | 43,4 % | 42,3 % | 47,6 % | 45,9 % | 43,9 % | 44,3 % |
Login required
This content is only available for logged in users
Lönsamhet och avkastning på kapital
| 2020 | 2021 | 2022 | 2023 | 2024e | 2025e | 2026e | 2027e | |
|---|---|---|---|---|---|---|---|---|
| EBITDA-% | 10,9 % | 12,1 % | 12,6 % | 9,9 % | 10,5 % | 10,8 % | 11,1 % | 11,2 % |
| EBIT-% | 8,1 % | 9,3 % | 9,8 % | 7,1 % | 7,4 % | 7,8 % | 8,2 % | 7,5 % |
| EBIT-% | 6,4 % | 7,6 % | 8,6 % | 5,6 % | 6,4 % | 6,8 % | 7,3 % | 7,5 % |
| ROE | 20,9 % | 22,1 % | 11,5 % | 12,1 % | 11,7 % | 13,2 % | 14,5 % | 14,7 % |
| ROI | 26,5 % | 15,9 % | 15,0 % | 9,5 % | 10,9 % | 12,4 % | 14,0 % | 14,8 % |
Login required
This content is only available for logged in users
Värdering
| 2020 | 2021 | 2022 | 2023 | 2024e | 2025e | 2026e | 2027e | |
|---|---|---|---|---|---|---|---|---|
| Pris per aktie (EUR) | 13,25 | 14,60 | 16,10 | 9,62 | 8,98 | 8,98 | 8,98 | 8,98 |
| Aktier | 7,0 | 7,0 | 8,1 | 8,1 | 8,1 | 8,1 | 8,1 | 8,1 |
| Börsvärde | 92,8 | 102,5 | 130,9 | 78,0 | 72,8 | 72,8 | 72,8 | 72,8 |
| Rörelsevärde | 86,5 | 115,1 | 132,7 | 81,7 | 72,5 | 67,7 | 62,3 | 56,4 |
| EV/S | 1,0 | 1,2 | 1,1 | 0,7 | 0,6 | 0,5 | 0,5 | 0,4 |
| EV/EBITDA | 9,5 | 9,6 | 8,9 | 6,7 | 5,7 | 4,9 | 4,1 | 3,5 |
| EV/EBIT (adj.) | 12,8 | 12,4 | 11,4 | 9,3 | 8,0 | 6,8 | 5,5 | 5,3 |
| EV/EBIT | 16,3 | 15,2 | 13,1 | 11,8 | 9,4 | 7,8 | 6,2 | 5,3 |
| P/E (just.) | 17,1 | 15,7 | 16,0 | 14,7 | 11,4 | 9,7 | 8,4 | 8,8 |
| P/E | 21,1 | 20,0 | 32,9 | 15,7 | 14,2 | 11,8 | 9,9 | 8,8 |
| P/B | 4,3 | 4,1 | 3,2 | 1,9 | 1,6 | 1,5 | 1,4 | 1,2 |
| P/S | 1,1 | 1,0 | 1,1 | 0,6 | 0,6 | 0,6 | 0,5 | 0,5 |
| Direktavkastning | 2,1 % | 1,2 % | 1,2 % | 2,7 % | 3,3 % | 3,9 % | 4,5 % | 5,0 % |
| Soliditet | 35,2 % | 30,5 % | 38,0 % | 42,0 % | 45,7 % | 48,6 % | 51,5 % | 55,5 % |
| Skuldsättning | −29,1 % | 50,2 % | 4,5 % | 8,8 % | −0,8 % | −10,5 % | −19,7 % | −28,1 % |
Login required
This content is only available for logged in users
Kvartalsuppgifter
| Q1/23 | Q2/23 | Q3/23 | Q4/23 | 2023 | Q1/24e | Q2/24e | Q3/24e | Q4/24e | |
|---|---|---|---|---|---|---|---|---|---|
| Omsättning | 65,3 | 57,4 | 122,7 | 63,3 | 58,3 | ||||
| EBITDA | 6,8 | 5,3 | 12,1 | 6,5 | 6,3 | ||||
| EBIT | 4,1 | 2,8 | 6,9 | 4,0 | 3,8 | ||||
| Vinst före skatt | 4,6 | 1,0 | 5,5 | 3,4 | 3,2 | ||||
| Nettoresultat | 3,5 | 1,4 | 5,0 | 2,6 | 2,5 |
Login required
This content is only available for logged in users
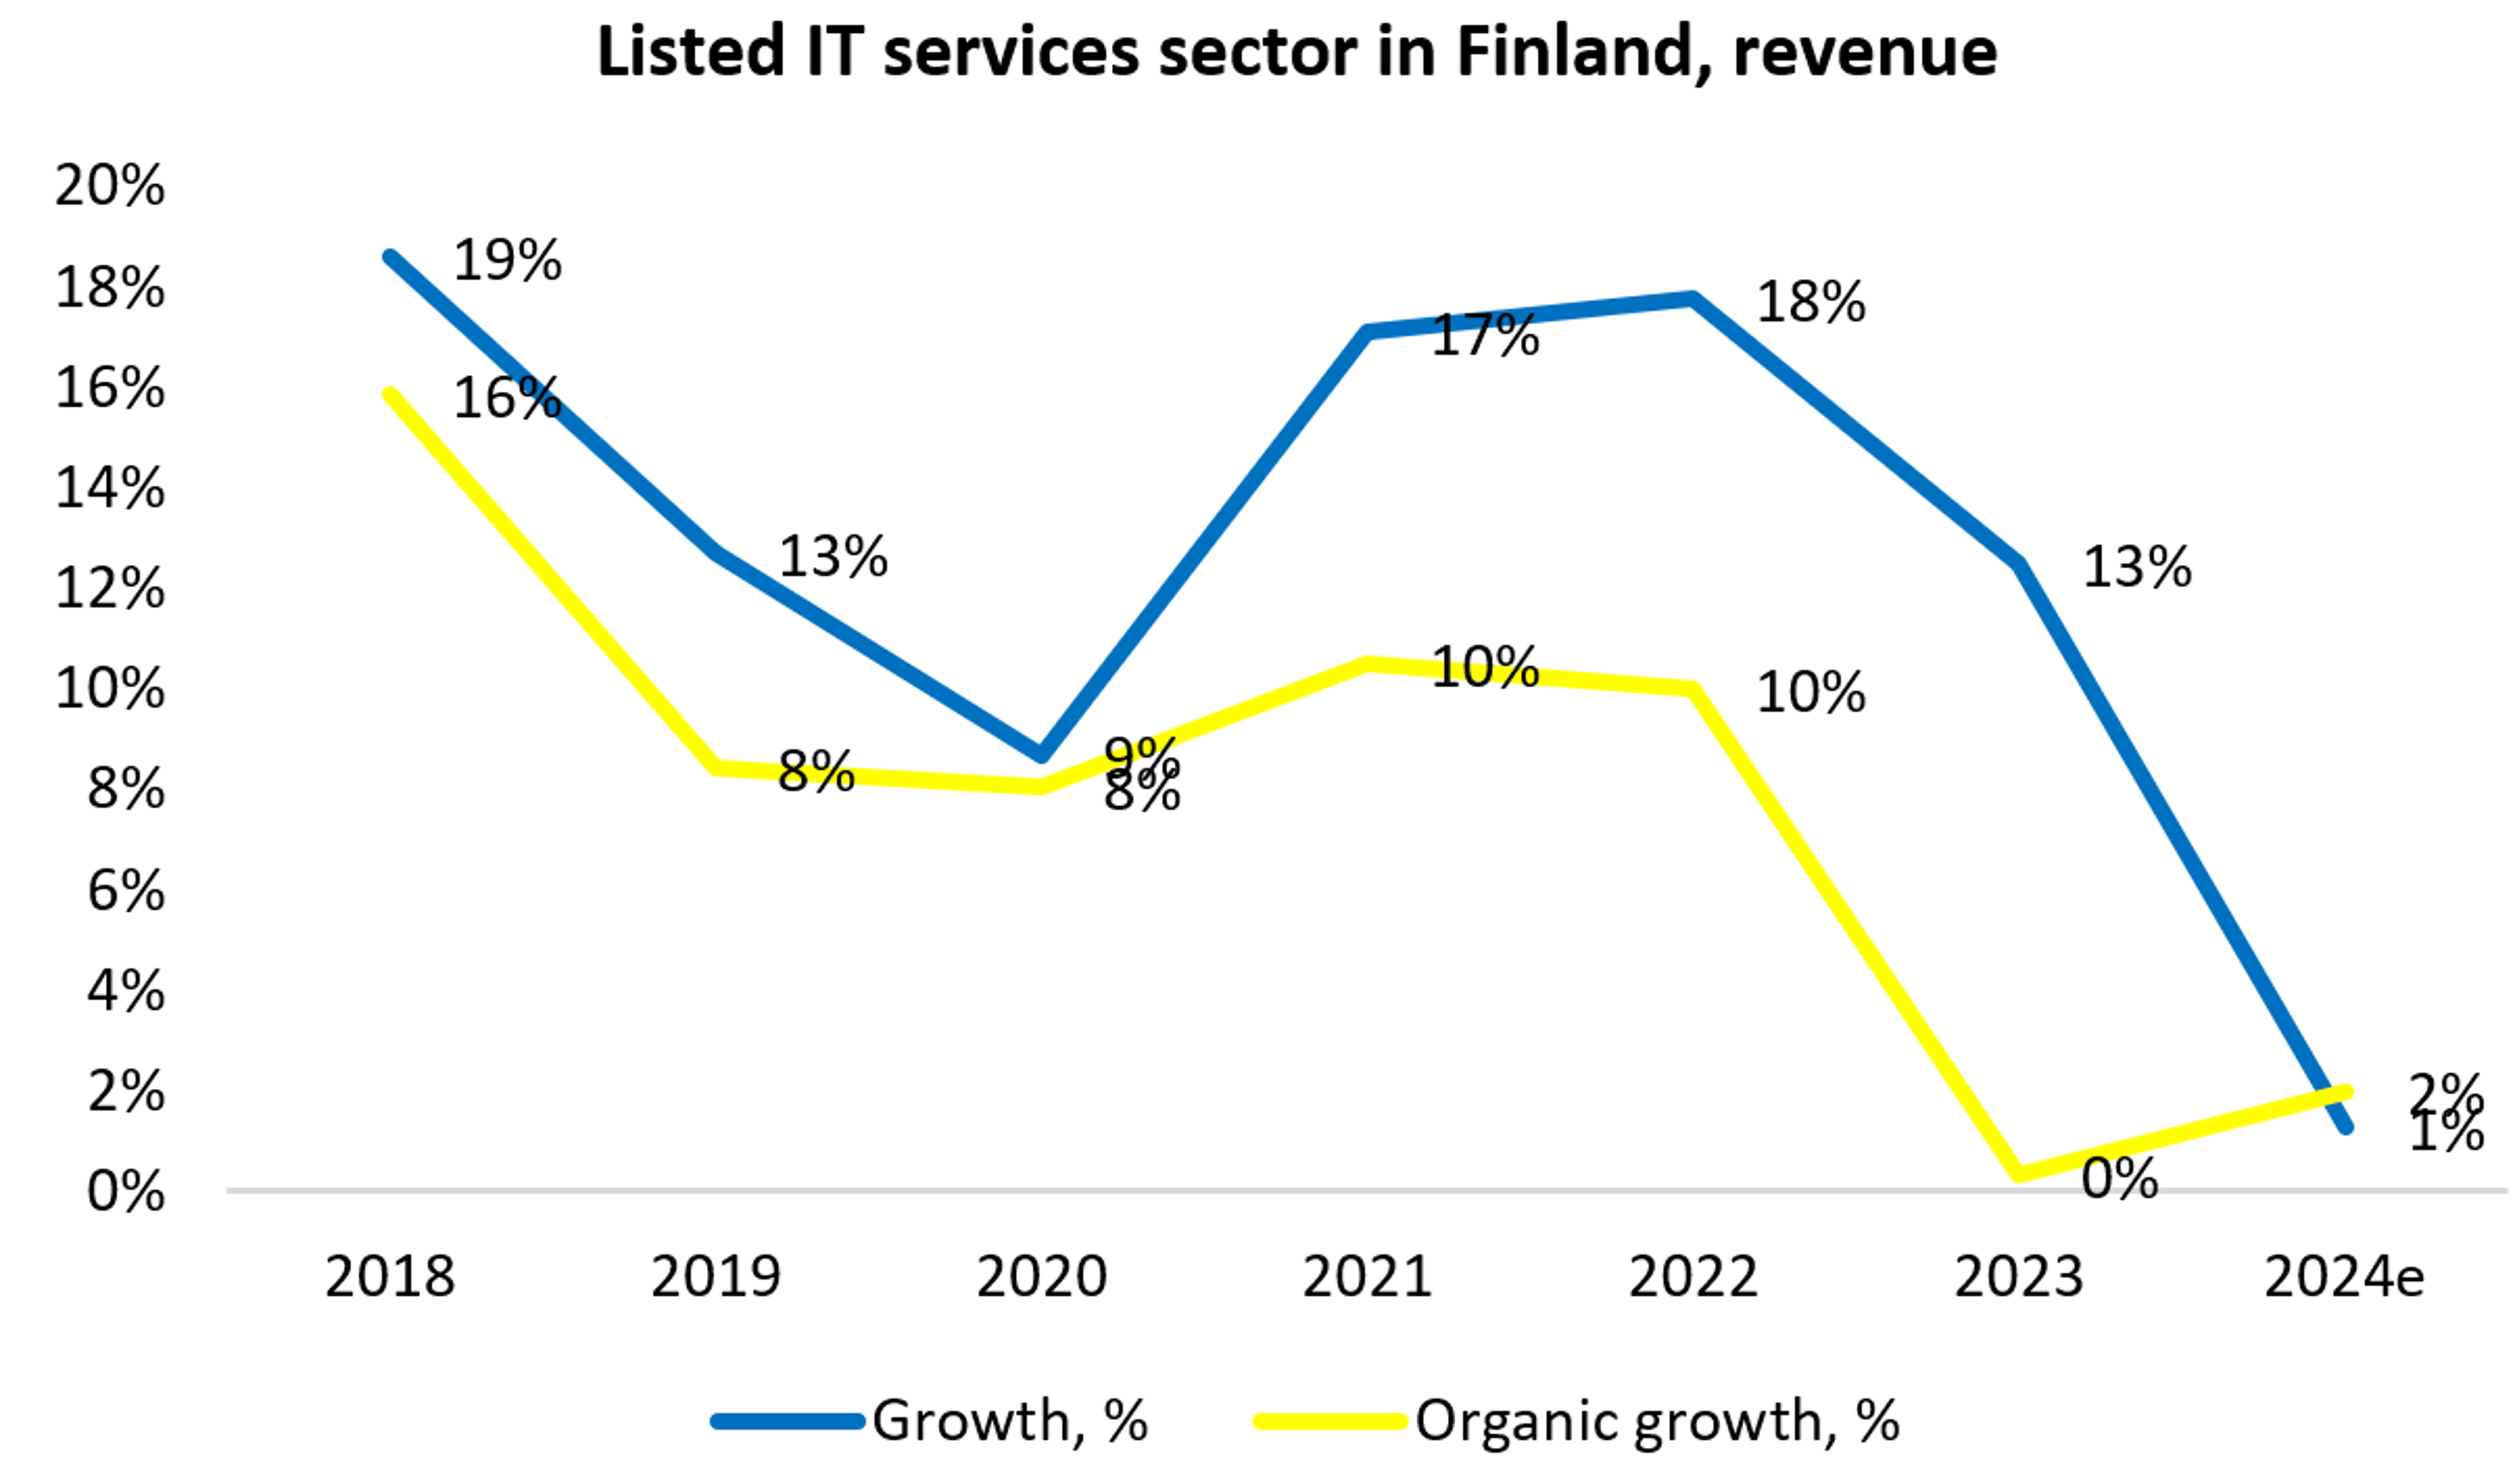
IT service sector: Our expectations for 2024 generally at the lower end of companies' guidance
Share subscription price and market value of the Siili Solutions Plc stock options 2024A
Join Inderes community
Don't miss out - create an account and get all the possible benefits
FREE account
Stock market's most popular morning newsletter
Analyst comments and recommendations
Stock comparison tool
PREMIUM account
All company reports and content
Premium tools (e.g. insider transactions & stock screener)
Model portfolio