Log in to your Inderes Free account to see all free content on this page.
Tietoevry
18.91 EUR +0.75%14,440 investors are following this company
Tietoevry is active in the IT sector. The company offers a range of software and cloud-based solutions, with the greatest specialist expertise in SaaS solutions. Expertise is found in business processes, application services, infrastructure solutions, and front-end solutions. Customers are found in a number of markets on a global level. The company was created in 2019 via a merger of Tieto and EVRY. The head office is located in Helsinki.
P/E (24e)
9.05
EV/EBIT (adj.) (24e)
8.56
EV/S (24e)
1.08
Dividend yield-% (24e)
7.93 %
Target price
24.00 EUR
Recommendation
Buy
Updated
25.4.2024
NASDAQ Helsinki
TIETO
Daily low / high price
18.77 / 19.02
EUR
Market cap
2.24B EUR
Turnover
5M EUR
Volume
265K
Business risk
Valuation risk
Current
Previous
Latest research
Analyst

Joni Grönqvist
Analyst
Latest videos
Financial calendar
Interim report
23.07.2024
Half year dividend
20.09.2024
Interim report
24.10.2024
Major OwnersSource: Millistream Market Data AB
| Owner | Capital | Votes |
|---|---|---|
| Solidium Oy | 10.9 % | 10.9 % |
| Ilmarinen Mutual Pension Insurance | 1.7 % | 1.7 % |
Premium
This content is for our Premium customers only.
Insider Transactions
| Insider | Date | Total value |
|---|---|---|
| Petter Söderström | 21.09.2023 | 9,747EUR |
| Kimmo Alkio | 05.05.2021 | 346,156EUR |
Premium
This content is for our Premium customers only.
Forum updates
Income statement
| 2020 | 2021 | 2022 | 2023 | 2024e | 2025e | 2026e | 2027e | |
|---|---|---|---|---|---|---|---|---|
| Revenue | 2,786.4 | 2,823.3 | 2,928.1 | 2,851.4 | 2,893.8 | 2,977.1 | 3,077.1 | 3,196.7 |
| growth-% | 60.7 % | 1.3 % | 3.7 % | -2.6 % | 1.5 % | 2.9 % | 3.4 % | 3.9 % |
| EBITDA | 322.5 | 552.0 | 428.5 | 408.1 | 441.4 | 446.9 | 473.4 | 487.0 |
| EBIT (adj.) | 355.1 | 367.7 | 379.0 | 358.7 | 364.2 | 383.6 | 410.6 | 425.9 |
| EBIT | 146.7 | 382.0 | 266.3 | 255.7 | 286.6 | 293.9 | 319.4 | 333.0 |
| Profit before taxes | 122.4 | 353.8 | 242.6 | 220.8 | 237.7 | 252.2 | 282.4 | 301.6 |
| Net income | 94.5 | 291.6 | 188.4 | 172.2 | 186.3 | 199.2 | 223.1 | 238.3 |
| EPS (adj.) | 2.19 | 2.20 | 2.35 | 2.14 | 2.09 | 2.28 | 2.49 | 2.63 |
| growth-% | 9.1 % | 0.5 % | 6.9 % | -8.8 % | -2.4 % | 9.1 % | 9.3 % | 5.6 % |
| Dividend | 1.32 | 1.40 | 1.45 | 1.47 | 1.50 | 1.55 | 1.60 | 1.65 |
| Dividend ratio | 165.4 % | 56.9 % | 91.1 % | 101.1 % | 95.4 % | 92.1 % | 84.9 % | 82.0 % |
Login required
This content is only available for logged in users
Profitability and return on capital
| 2020 | 2021 | 2022 | 2023 | 2024e | 2025e | 2026e | 2027e | |
|---|---|---|---|---|---|---|---|---|
| EBITDA-% | 11.6 % | 19.6 % | 14.6 % | 14.3 % | 15.3 % | 15.0 % | 15.4 % | 15.2 % |
| EBIT-% (adj.) | 12.7 % | 13.0 % | 12.9 % | 12.6 % | 12.6 % | 12.9 % | 13.3 % | 13.3 % |
| EBIT-% | 5.3 % | 13.5 % | 9.1 % | 9.0 % | 9.9 % | 9.9 % | 10.4 % | 10.4 % |
| ROE | 5.7 % | 16.9 % | 10.6 % | 10.3 % | 11.7 % | 12.5 % | 13.7 % | 14.3 % |
| ROI | 5.4 % | 13.7 % | 9.8 % | 9.4 % | 10.8 % | 11.6 % | 12.8 % | 13.5 % |
Login required
This content is only available for logged in users
Valuation
| 2020 | 2021 | 2022 | 2023 | 2024e | 2025e | 2026e | 2027e | |
|---|---|---|---|---|---|---|---|---|
| Share price (EUR) | 26.86 | 27.48 | 26.52 | 21.54 | 18.91 | 18.91 | 18.91 | 18.91 |
| Shares | 118.4 | 118.4 | 118.4 | 118.4 | 118.4 | 118.4 | 118.4 | 118.4 |
| Market cap | 3,180.9 | 3,254.3 | 3,140.3 | 2,550.6 | 2,239.2 | 2,239.2 | 2,239.2 | 2,239.2 |
| Enterprise value | 4,097.2 | 3,900.1 | 3,850.6 | 3,494.1 | 3,118.0 | 3,033.0 | 2,928.3 | 2,844.7 |
| EV/S | 1.5 | 1.4 | 1.3 | 1.2 | 1.1 | 1.0 | 1.0 | 0.9 |
| EV/EBITDA | 12.7 | 7.1 | 9.0 | 8.6 | 7.1 | 6.8 | 6.2 | 5.8 |
| EV/EBIT (adj.) | 11.5 | 10.6 | 10.2 | 9.7 | 8.6 | 7.9 | 7.1 | 6.7 |
| EV/EBIT | 27.9 | 10.2 | 14.5 | 13.7 | 10.9 | 10.3 | 9.2 | 8.5 |
| P/E (adj.) | 12.3 | 12.5 | 11.3 | 10.1 | 9.0 | 8.3 | 7.6 | 7.2 |
| P/E | 33.7 | 11.2 | 16.7 | 14.8 | 12.0 | 11.2 | 10.0 | 9.4 |
| P/B | 2.0 | 1.8 | 1.8 | 1.6 | 1.4 | 1.4 | 1.4 | 1.3 |
| P/S | 1.1 | 1.2 | 1.1 | 0.9 | 0.8 | 0.8 | 0.7 | 0.7 |
| Dividend yield | 4.9 % | 5.1 % | 5.5 % | 6.8 % | 7.9 % | 8.2 % | 8.5 % | 8.7 % |
| Equity ratio | 45.1 % | 50.8 % | 50.7 % | 45.8 % | 47.8 % | 48.6 % | 49.9 % | 51.4 % |
| Gearing ratio | 56.3 % | 35.5 % | 41.3 % | 58.5 % | 55.5 % | 49.4 % | 41.9 % | 35.7 % |
Login required
This content is only available for logged in users
Quarter data
| Q2/23 | Q3/23 | Q4/23 | 2023 | Q1/24 | Q2/24e | Q3/24e | Q4/24e | 2024e | |
|---|---|---|---|---|---|---|---|---|---|
| Revenue | 695.1 | 659.7 | 752.2 | 2,851.4 | 733.9 | 706.3 | 672.9 | 780.7 | 2,893.8 |
| EBITDA | 80.2 | 98.1 | 122.5 | 408.1 | 103.2 | 98.1 | 107.9 | 132.2 | 441.4 |
| EBIT | 41.2 | 61.7 | 84.2 | 255.7 | 62.7 | 60.0 | 69.8 | 94.1 | 286.6 |
| Profit before taxes | 34.7 | 53.3 | 70.6 | 220.8 | 50.5 | 48.0 | 57.5 | 81.7 | 237.7 |
| Net income | 27.4 | 41.4 | 55.0 | 172.2 | 38.4 | 38.0 | 45.4 | 64.5 | 186.3 |
Login required
This content is only available for logged in users
ShowingAll content types
Tietoevry appoints Cosimo De Carlo as Managing Director, Tietoevry Create
Spin-off setbacks, but the stock has overreacted
Join Inderes community
Don't miss out - create an account and get all the possible benefits
FREE account
Stock market's most popular morning newsletter
Analyst comments and recommendations
Stock comparison tool
PREMIUM account
All company reports and content
Premium tools (e.g. insider transactions & stock screener)
Model portfolio
TIETO: Obtained noteholder consents in respect of the EUR 300 million notes due 2025 not becoming effective due to the discontinuation of Tietoevry's demerger process
Obtained noteholder consents in respect of the EUR 300 million notes due 2025 not becoming effective due to the discontinuation of Tietoevry's demerger process
Tietoevry Interim Report Q1 2024
TIETO: Tietoevry's Board of Directors decides on a directed share issue without payment as part of the share-based incentive schemes of the Group's key employees
Tietoevry's Interim Report 1/2024: Q1 performance as anticipated - Tietoevry Banking strategic review concluded
Tietoevry's Interim Report 1/2024: Q1 performance as anticipated - Tietoevry Banking strategic review concluded
Tietoevry's Board of Directors decides on a directed share issue without payment as part of the share-based incentive schemes of the Group's key employees
Inside Information: Strategic review of Tietoevry Banking concluded, Banking continues as a specialized business in the Group - value currently not maximized through a listing or sale
Inside Information: Strategic review of Tietoevry Banking concluded, Banking continues as a specialized business in the Group - value currently not maximized through a listing or sale
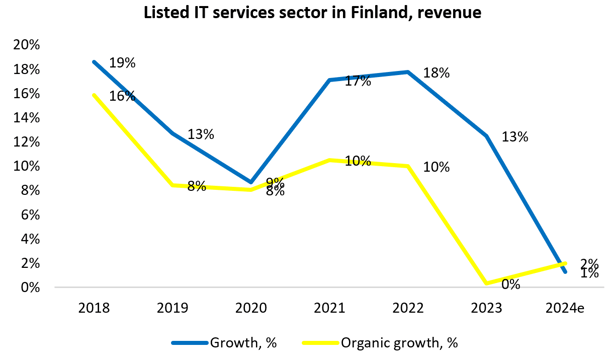
IT service sector: Our expectations for 2024 generally at the lower end of companies' guidance
Tietoevry Corporation: solicitation of consents in respect of EUR 300 000 000 notes due 2025 has succeeded enabling the separation of Banking business
Tietoevry Corporation: solicitation of consents in respect of EUR 300 000 000 notes due 2025 has succeeded enabling the separation of Banking business