Log in to your Inderes Free account to see all free content on this page.
Meriaura Group
0.047 EUR -3.69%4,452 investors are following this company
Meriaura Group has two business areas: Maritime Logistics and Renewable Energy. Meriaura transports dry cargo and executes demanding project deliveries in Northern Europe. The company offers CO2 reducing marine transport services based on the use of recycled, in-house produced bio-oil. Meriaura Energy designs and delivers clean energy production solutions for district heating and industrial use worldwide, with Europe as the main market area.
P/E (24e)
30.73
EV/EBIT (adj.) (24e)
20.77
P/B (24e)
1.01
Dividend yield-% (24e)
-
Target price
0.04 EUR
Recommendation
Reduce
Updated
3.5.2024
First North Finland
MERIH
Daily low / high price
0.045 / 0.048
EUR
Market cap
40.74M EUR
Turnover
34.19K EUR
Volume
736K
Business risk
Valuation risk
Current
Previous
Latest research
Extensive report
Inderes' extensive report is an investor's handbook on customer companies covered by our research.
The latest extensive report was released
Read the reportAnalyst

Pauli Lohi
Analyst
Financial calendar
Interim report
22.08.2024
Business review
31.10.2024
Major OwnersSource: Millistream Market Data AB
| Owner | Capital | Votes |
|---|---|---|
| Meriaura Invest Oy | 61.2 % | 61.2 % |
| Hybrid Consulting Oy | 3.9 % | 3.9 % |
Premium
This content is for our Premium customers only.
Insider Transactions
| Insider | Date | Total value |
|---|---|---|
| Repo Eljas | 30.03.2023 | 33,937SEK |
| Eero Kalevi Auranne | 27.03.2023 | 347EUR |
Premium
This content is for our Premium customers only.
Forum updates
Income statement
| 2020 | 2021 | 2022 | 2023 | 2024e | 2025e | 2026e | 2027e | |
|---|---|---|---|---|---|---|---|---|
| Revenue | 5.1 | 2.5 | 8.6 | 66.2 | 77.8 | 84.6 | 93.6 | 100.4 |
| growth-% | 49.8 % | -51.2 % | 245.8 % | 666.5 % | 17.6 % | 8.8 % | 10.6 % | 7.3 % |
| EBITDA | -3.4 | -4.2 | -3.6 | 6.3 | 8.5 | 10.0 | 13.4 | 15.0 |
| EBIT (adj.) | -3.9 | -4.6 | -3.8 | 1.0 | 2.8 | 4.2 | 5.8 | 6.6 |
| EBIT | -3.9 | -4.6 | -3.8 | 1.0 | 2.8 | 4.2 | 5.8 | 6.6 |
| Profit before taxes | -5.0 | -5.8 | -4.1 | -0.3 | 1.5 | 2.7 | 4.1 | 5.0 |
| Net income | -5.0 | -5.8 | -4.1 | -0.3 | 1.4 | 2.5 | 3.9 | 4.8 |
| EPS (adj.) | -0.08 | -0.03 | -0.01 | -0.00 | 0.00 | 0.00 | 0.00 | 0.01 |
| growth-% | 84.3 % | 56.6 % | 22.1 % | |||||
| Dividend | 0.00 | 0.00 | 0.00 | 0.00 | 0.00 | 0.00 | 0.00 | 0.00 |
| Dividend ratio |
Login required
This content is only available for logged in users
Profitability and return on capital
| 2020 | 2021 | 2022 | 2023 | 2024e | 2025e | 2026e | 2027e | |
|---|---|---|---|---|---|---|---|---|
| EBITDA-% | -66.6 % | -167.2 % | -41.4 % | 9.6 % | 10.9 % | 11.8 % | 14.3 % | 14.9 % |
| EBIT-% (adj.) | -76.2 % | -182.4 % | -43.6 % | 1.6 % | 3.7 % | 4.9 % | 6.2 % | 6.6 % |
| EBIT-% | -76.2 % | -182.4 % | -43.6 % | 1.6 % | 3.7 % | 4.9 % | 6.2 % | 6.6 % |
| ROE | -120.6 % | -103.4 % | -19.4 % | -0.7 % | 3.3 % | 5.9 % | 8.5 % | 9.5 % |
| ROI | -77.7 % | -76.2 % | -12.0 % | 1.8 % | 4.4 % | 5.8 % | 7.4 % | 8.0 % |
Login required
This content is only available for logged in users
Valuation
| 2020 | 2021 | 2022 | 2023 | 2024e | 2025e | 2026e | 2027e | |
|---|---|---|---|---|---|---|---|---|
| Share price (EUR) | 0.14 | 0.05 | 0.07 | 0.05 | 0.05 | 0.05 | 0.05 | 0.05 |
| Shares | 62.9 | 165.2 | 783.1 | 886.8 | 886.8 | 886.8 | 886.8 | 886.8 |
| Market cap | 9.0 | 7.9 | 54.8 | 43.5 | 41.7 | 41.7 | 41.7 | 41.7 |
| Enterprise value | 7.0 | 4.1 | 71.5 | 56.8 | 59.2 | 63.5 | 65.9 | 59.7 |
| EV/S | 1.4 | 1.6 | 8.3 | 0.9 | 0.8 | 0.7 | 0.7 | 0.6 |
| EV/EBITDA | - | - | - | 9.0 | 7.0 | 6.4 | 4.9 | 4.0 |
| EV/EBIT (adj.) | - | - | - | 54.4 | 20.8 | 15.3 | 11.3 | 9.1 |
| EV/EBIT | - | - | - | 54.4 | 20.8 | 15.3 | 11.3 | 9.1 |
| P/E (adj.) | - | - | - | - | 30.7 | 16.7 | 10.6 | 8.7 |
| P/E | - | - | - | - | 30.7 | 16.7 | 10.6 | 8.7 |
| P/B | 1.9 | 1.2 | 1.5 | 1.1 | 1.0 | 1.0 | 0.9 | 0.8 |
| P/S | 1.8 | 3.2 | 6.3 | 0.7 | 0.5 | 0.5 | 0.4 | 0.4 |
| Dividend yield | ||||||||
| Equity ratio | 66.2 % | 79.5 % | 55.0 % | 58.9 % | 54.7 % | 52.5 % | 52.2 % | 57.4 % |
| Gearing ratio | -41.9 % | -58.8 % | 47.2 % | 33.3 % | 42.3 % | 49.7 % | 50.7 % | 34.4 % |
Login required
This content is only available for logged in users
Quarter data
| Q2/23 | Q3/23 | Q4/23 | 2023 | Q1/24 | Q2/24e | Q3/24e | Q4/24e | 2024e | |
|---|---|---|---|---|---|---|---|---|---|
| Revenue | 15.3 | 15.7 | 19.0 | 66.2 | 17.9 | 19.8 | 19.2 | 20.9 | 77.8 |
| EBITDA | 1.1 | 1.7 | 2.1 | 6.3 | 1.2 | 2.2 | 2.2 | 2.9 | 8.5 |
| EBIT | -0.2 | 0.3 | 0.8 | 1.0 | -0.2 | 0.9 | 0.7 | 1.5 | 2.8 |
| Profit before taxes | -0.5 | 0.0 | 0.2 | -0.3 | -0.5 | 0.6 | 0.4 | 1.1 | 1.5 |
| Net income | -0.5 | 0.0 | 0.3 | -0.3 | -0.5 | 0.5 | 0.3 | 1.0 | 1.4 |
Login required
This content is only available for logged in users
ShowingAll content types
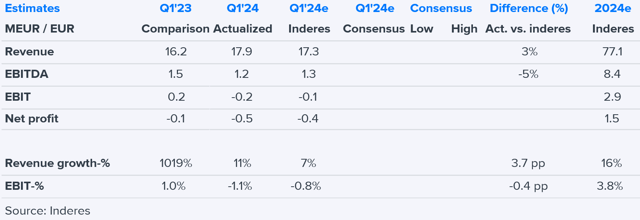
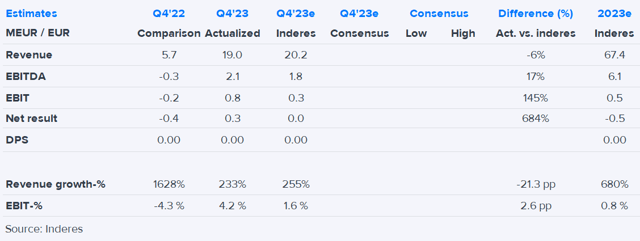
Meriaura Group Q1 morning result: A challenging quarter as expected, but outlook pretty positive
Meriaura Group: Sizable solar thermal delivery to Germany supports our growth forecasts
Join Inderes community
Don't miss out - create an account and get all the possible benefits
FREE account
Stock market's most popular morning newsletter
Analyst comments and recommendations
Stock comparison tool
PREMIUM account
All company reports and content
Premium tools (e.g. insider transactions & stock screener)
Model portfolio
Meriaura Group Plc: Business Review for January–March 2024
Inside information: Meriaura Energy to deliver a solar thermal plant for the district heating network operator of Lübeck in Germany
Start of the year impacted by union strikes
Meriaura Group plans to sell a minority holding in the maritime logistics business to the Group’s main shareholder
SUPPLEMENT – Inside information: Meriaura Group's board has conditionally decided to sell Meriaura's minority ownership to Meriaura Invest to rearrange the group's financing
Inside information: Meriaura Group's board has conditionally decided to sell Meriaura's minority ownership to Meriaura Invest to rearrange the group's financing
Meriaura’s sustainability report 2023 published: increased use of bio-oil in the fleet
Meriaura Group invests heavily in low-emission freight capacity
Small but interesting solar thermal project in France for Meriaura Group
Inside information: Meriaura Energy signs a contract with Serres Vermeil SARL to deliver a solar thermal plant in Palau-del-Vidre, France
Inside information: Meriaura orders two bio-oil-powered cargo ships from the Dutch Royal Bodewes Shipyard
Meriaura Group Oyj: Notice to the Annual General Meeting of Meriaura Group Plc.
Meriaura Group Plc’s annual report for 2023 published
Port strikes bother Meriaura Group
Meriaura: Earnings outlook for sea freight stabilized