Witted Megacorp is an IT consulting company. The company offers a wide range of consulting services and IT solutions, mainly services related to project and business development. The solutions are used by a number of corporate customers in various sectors. In addition to the main business, various ancillary services are offered. The largest operations are found in the Nordic market.
The IT service sector's Q3 earnings season began with cautious optimism, as the market looked for signs of a gradual turnaround in the IT service market. Unfortunately, the sentiment remained mostly cautious.
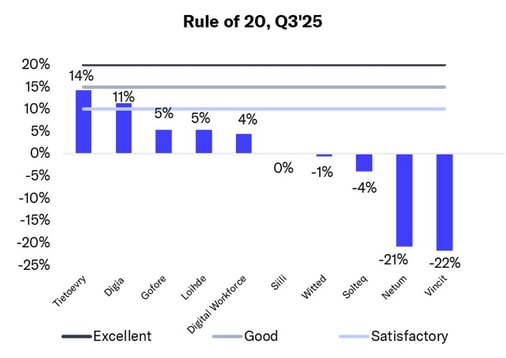
In the rest of the Nordic countries, organic revenue development turned downward and profitability weakened in Q2. Thus, even applying the Rule of 20, the situation in the IT services market remains distinctly challenging, with only one company achieving good performance and two achieving satisfactory performance.
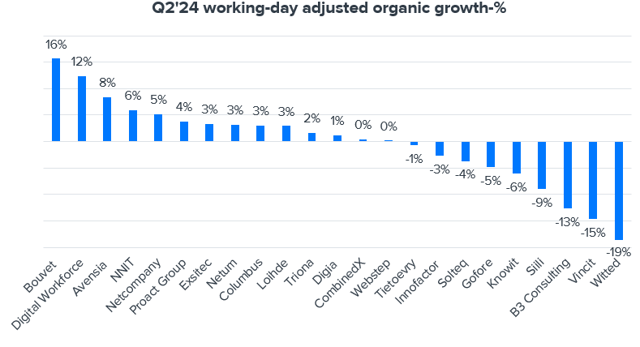
The IT service sector entered the Q2 earnings season in a cautious mood, albeit with expectations of a turnaround. In reality, however, the situation deteriorated even further, with revenue falling more than before and beyond our expectations and profitability remaining at a very low level.
Join Inderes community
Don't miss out - create an account and get all the possible benefits
The IT services sector's Q1 earnings season was still approached with a cautious mood, but this time the reason was Trump's tariff threats. Possible tariffs would not directly hit the IT services sector, but they would certainly have an indirect impact through customer caution.
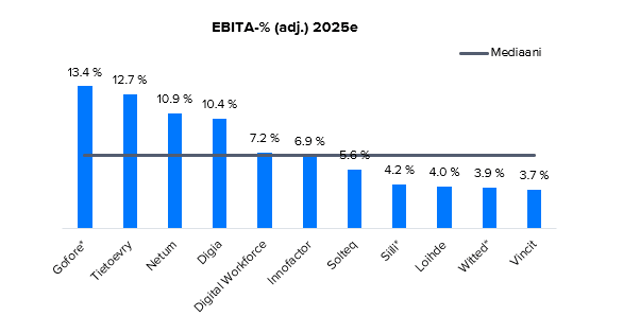
We expect the performance of the IT service sector to improve as a whole in 2025. This year, as the market decline presumably stabilizes/turns back to growth, we should be able to see which companies have adapted to the changing market situation and whose strategy is working.
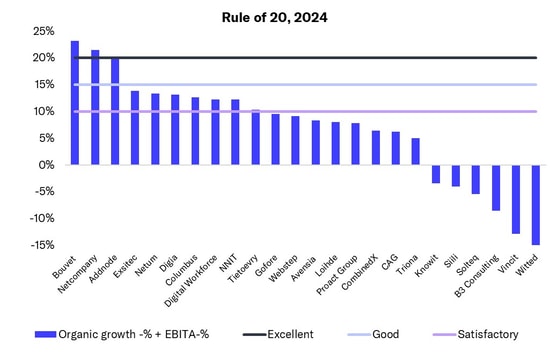
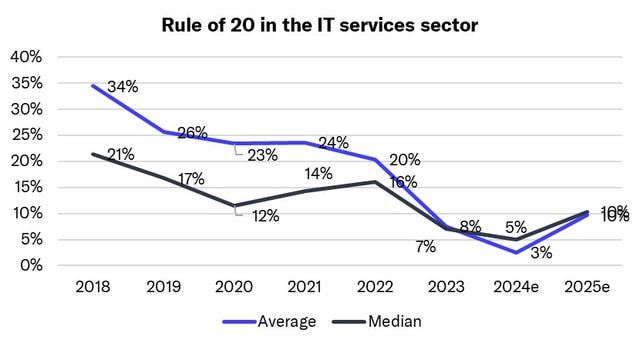
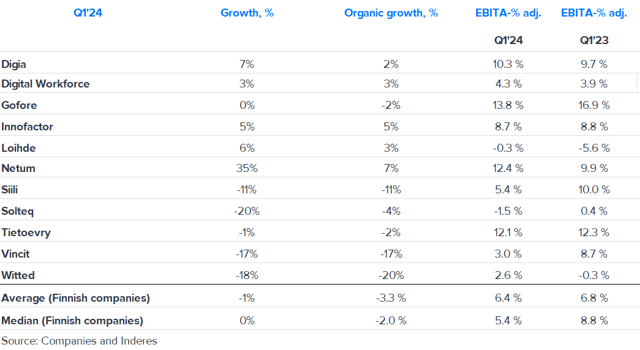
We examined Nordic, listed IT service companies with the 'Rule of 20' metric we launched, measured with which a few companies achieved excellent performance in 2024. On average, Finnish IT service companies fared worse last year than other Nordic companies. Overall, however, it can be said that 2024 was still challenging throughout the Nordics.
Looking at the year as a whole, the difficult market situation is illustrated by the fact that none of the listed companies in the IT service sector achieved excellent or even good performance according to the Rule of 20 we have introduced.
We are launching our own Rule of 20 for the IT services sector, which we believe works well, if not best, as a single parameter to measure the operational performance of the sector and especially of the companies.
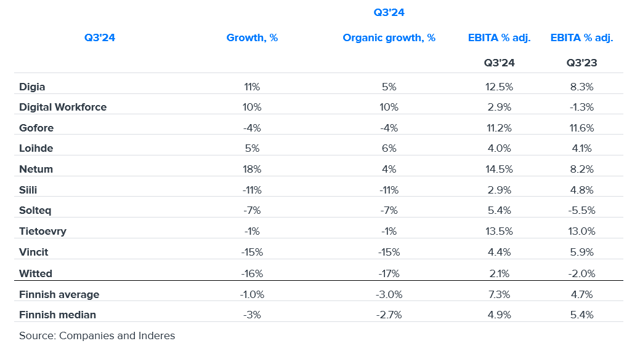
The IT services sector's Q3 results were met with a cautious mood after five companies in the sector issued profit warnings in just over a month. The decline in working day-adjusted organic revenue development for the sector's companies accelerated slightly as customers continued to economize, although the comparison period was already weak for most of them. Profitability, on the other hand, was significantly higher year-on-year, but the group was clearly divided between strong and weak performers.
With the Q2 reports and subsequent earnings warnings, our revenue and profitability expectations have declined slightly. The expected strengthening of the general economic development in Finland and Europe and the interest rate cuts provide some light at the end of the tunnel and create the conditions for a gradually improving demand outlook also for the IT services sector next year.
Finnish listed IT services companies' organic revenue decline accelerated slightly, although the comparison period was already weak for several of them.
The strengthening of the general economic situation in Finland and Europe and the expected decline in interest rates provide some light at the end of the tunnel and, in our opinion, create the conditions for a gradually improving demand outlook also for the IT services sector next year.
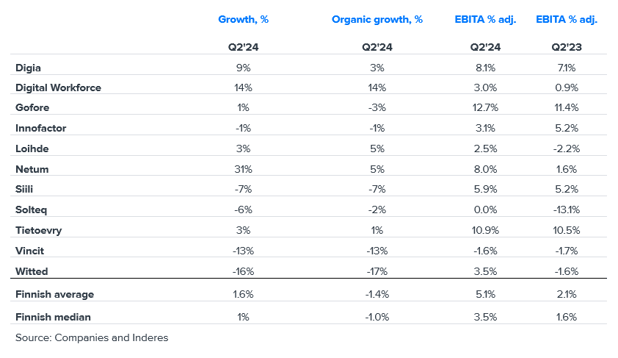
The organic revenue development of the Finnish listed IT service companies took a downturn from a strong comparison period. At the same time, profitability declined from the good comparison period, although slightly less than expected, helped by cost savings.
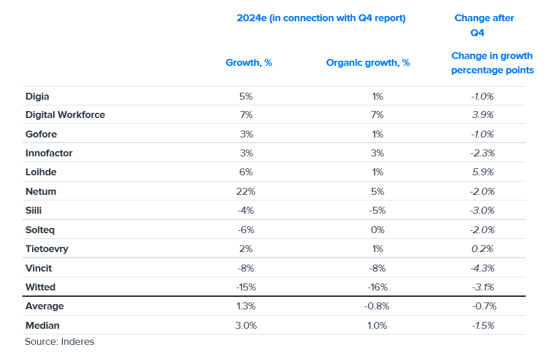
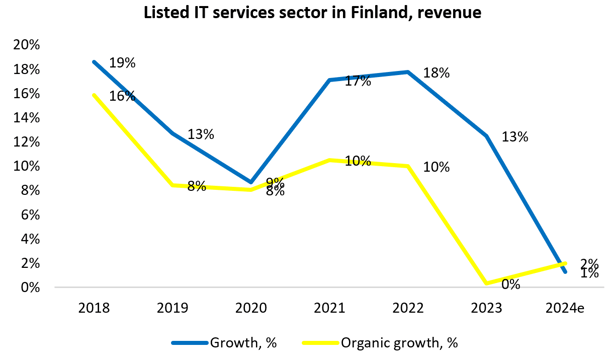
We estimate that listed IT service companies will grow moderately in 2024, but well below historical growth rates. Overall, our expectations for 2024 are generally at the lower end of companies' guidance.
We examined the development of valuation levels in the IT service sector through the forward-looking EV/S ratio in 2017-2024. The valuation levels have hit the bottom of the review period. The uncertain short-term outlook and the rise in interest rates partly justify a lower valuation, but we feel the sector’s expected return is at an attractive level as a whole.
We expect the dual dynamics of the IT services market to continue next year and slow down growth. In our estimates, profitability in the sector improves slightly, driven by cost savings, but still stays below potential due to headwinds.
Overall, the Q3 earnings season was stronger than our cautious expectations and the market continued to be mixed. Many areas are still performing well and in the weaker areas it seems that, at least temporarily, the bottom of demand has been touched. There are already some cautious comments on the better, but in our view it is still too early to draw larger and broader conclusions.