Log in to your Inderes Free account to see all free content on this page.
Titanium
10.3 EUR +1.48%6,490 investors are following this company
Titanium is active in the financial industry. The Group currently offers a wide range of financial services mainly in asset management, loan financing, and pensions. The Group also manages a number of investment funds and structured financial products. The company was originally founded in 2009 and is headquartered in Helsinki.
P/E (24e)
11.76
EV/EBIT (adj.) (24e)
8.11
P/B (24e)
5.52
Dividend yield-% (24e)
8.86 %
Target price
12.00 EUR
Recommendation
Reduce
Updated
18.4.2024
First North Finland
TITAN
Daily low / high price
10.1 / 10.35
EUR
Market cap
106.82M EUR
Turnover
69.47K EUR
Volume
6.8K
Business risk
Valuation risk
Current
Previous
Major OwnersSource: Millistream Market Data AB
Owner | Capital | Votes |
---|---|---|
Santanen Tommi Mikael | 13.2 % | 13.2 % |
LKL Holding Oy | 10.1 % | 10.1 % |
Premium
This content is for our Premium customers only.
Insider Transactions
Insider | Date | Total value |
---|---|---|
Joni Niiranen | 05.04.2024 | 12,700EUR |
Joni Niiranen | 04.04.2024 | 25,497EUR |
Premium
This content is for our Premium customers only.
Forum updates
Income statement
2020 | 2021 | 2022 | 2023 | 2024e | 2025e | 2026e | 2027e | |
---|---|---|---|---|---|---|---|---|
Revenue | 20.2 | 23.5 | 27.9 | 26.2 | 25.0 | 27.2 | 29.4 | 31.4 |
growth-% | 9.6 % | 16.3 % | 18.8 % | -6.0 % | -4.8 % | 9.0 % | 8.0 % | 6.6 % |
EBITDA | 12.1 | 14.2 | 17.3 | 14.3 | 12.0 | 13.2 | 14.3 | 15.0 |
EBIT (adj.) | 11.5 | 13.8 | 16.9 | 13.7 | 11.4 | 12.4 | 13.4 | 14.2 |
EBIT | 9.8 | 12.0 | 15.1 | 12.6 | 11.4 | 12.4 | 13.4 | 14.2 |
Profit before taxes | 9.9 | 12.0 | 15.1 | 12.6 | 11.4 | 12.4 | 13.4 | 14.2 |
Net income | 7.6 | 9.3 | 11.7 | 9.7 | 9.1 | 9.9 | 10.7 | 11.4 |
EPS (adj.) | 0.91 | 1.08 | 1.30 | 1.05 | 0.88 | 0.95 | 1.02 | 1.07 |
growth-% | 14.3 % | 19.1 % | 20.4 % | -19.4 % | -16.4 % | 8.1 % | 7.8 % | 5.3 % |
Dividend | 0.81 | 0.91 | 1.36 | 1.16 | 0.91 | 0.96 | 1.06 | 0.97 |
Dividend ratio | 109.6 % | 100.1 % | 119.8 % | 124.0 % | 104.3 % | 101.7 % | 104.3 % | 90.0 % |
Login required
This content is only available for logged in users
Profitability and return on capital
2020 | 2021 | 2022 | 2023 | 2024e | 2025e | 2026e | 2027e | |
---|---|---|---|---|---|---|---|---|
EBITDA-% | 59.7 % | 60.4 % | 62.2 % | 54.7 % | 48.2 % | 48.6 % | 48.5 % | 48.0 % |
EBIT-% (adj.) | 56.9 % | 58.6 % | 60.4 % | 52.3 % | 45.7 % | 45.5 % | 45.6 % | 45.3 % |
EBIT-% | 48.5 % | 51.2 % | 54.2 % | 47.9 % | 45.7 % | 45.5 % | 45.6 % | 45.3 % |
ROE | 33.7 % | 40.0 % | 46.4 % | 39.8 % | 43.7 % | 50.5 % | 53.3 % | 55.2 % |
ROI | 45.1 % | 52.7 % | 61.0 % | 51.5 % | 52.1 % | 55.4 % | 55.6 % | 55.1 % |
Login required
This content is only available for logged in users
Valuation
2020 | 2021 | 2022 | 2023 | 2024e | 2025e | 2026e | 2027e | |
---|---|---|---|---|---|---|---|---|
Share price (EUR) | 12.95 | 15.00 | 15.55 | 17.20 | 10.30 | 10.30 | 10.30 | 10.30 |
Shares | 10.2 | 10.2 | 10.3 | 10.4 | 10.4 | 10.5 | 10.5 | 10.6 |
Market cap | 132.4 | 153.3 | 160.1 | 178.4 | 107.3 | 107.9 | 108.4 | 108.9 |
Enterprise value | 118.3 | 136.7 | 139.4 | 160.7 | 92.5 | 92.9 | 93.0 | 93.6 |
EV/S | 5.9 | 5.8 | 5.0 | 6.1 | 3.7 | 3.4 | 3.2 | 3.0 |
EV/EBITDA | 9.8 | 9.6 | 8.0 | 11.2 | 7.7 | 7.0 | 6.5 | 6.2 |
EV/EBIT (adj.) | 10.3 | 9.9 | 8.3 | 11.7 | 8.1 | 7.5 | 6.9 | 6.6 |
EV/EBIT | 12.1 | 11.4 | 9.2 | 12.8 | 8.1 | 7.5 | 6.9 | 6.6 |
P/E (adj.) | 14.3 | 13.9 | 12.0 | 16.4 | 11.8 | 10.9 | 10.1 | 9.6 |
P/E | 17.5 | 16.5 | 13.7 | 18.4 | 11.8 | 10.9 | 10.1 | 9.6 |
P/B | 5.8 | 6.4 | 6.1 | 8.0 | 5.5 | 5.4 | 5.3 | 5.3 |
P/S | 6.6 | 6.5 | 5.7 | 6.8 | 4.3 | 4.0 | 3.7 | 3.5 |
Dividend yield | 6.3 % | 6.1 % | 8.7 % | 6.7 % | 8.9 % | 9.4 % | 10.3 % | 9.4 % |
Equity ratio | 88.0 % | 82.3 % | 83.7 % | 81.5 % | 73.1 % | 69.9 % | 68.1 % | 65.2 % |
Gearing ratio | -62.0 % | -69.7 % | -78.2 % | -79.3 % | -76.2 % | -75.4 % | -74.9 % | -73.9 % |
Login required
This content is only available for logged in users
Quarter data
Q1/23 | Q2/23 | Q3/23 | Q4/23 | 2023 | Q1/24e | Q2/24e | Q3/24e | Q4/24e | |
---|---|---|---|---|---|---|---|---|---|
Revenue | 13.6 | 12.6 | 26.2 | 12.2 | 12.8 | ||||
EBITDA | 7.9 | 6.4 | 14.3 | 6.0 | 6.1 | ||||
EBIT | 6.7 | 5.8 | 12.6 | 5.7 | 5.7 | ||||
Profit before taxes | 6.7 | 5.8 | 12.6 | 5.7 | 5.7 | ||||
Net income | 5.2 | 4.5 | 9.7 | 4.5 | 4.6 |
Login required
This content is only available for logged in users
ShowingAll content types
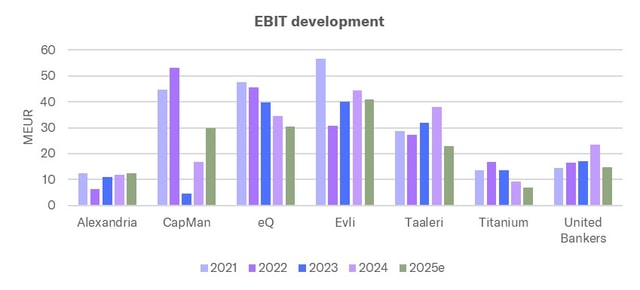
Titanium: Everything set for accelerated earnings growth
Join Inderes community
Don't miss out - create an account and get all the possible benefits
FREE account
Stock market's most popular morning newsletter
Analyst comments and recommendations
Stock comparison tool
PREMIUM account
All company reports and content
Premium tools (e.g. insider transactions & stock screener)
Model portfolio